


Introduction to Power Query
Power Query was officially released by Microsoft in 2013 as an add-in that was installable in Excel 2010 and Excel 2013. It was originally designed to help Excel users connect to data directly, especially data not housed in an Excel file. Examples of such data are relational database tables, SharePoint lists, text files, and cloud data sources. It creates a pathway to connect to these types of data, transform the data, and then load the data into Excel sheets, tables, or PivotTables. In essence, Power Query is an Extract, Transform, and Load (ETL) tool.
Power Query has changed a lot since the first version. In Excel 2010 and Excel 2013, it had a dedicated menu and was a Component Object Model (COM) add-in that could be enabled or disabled after installing the Power Query add-in. The following screenshot shows what it was like in the early versions in Excel 2010 and Excel 2013:
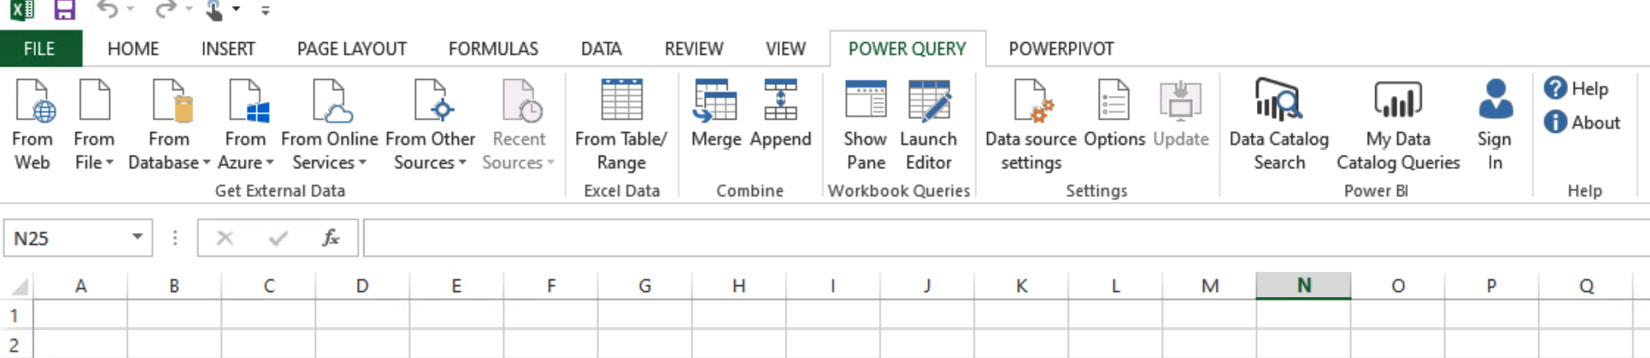
Figure 4.1 – Power Query in Excel 2013
...