


The different ways to bring data into Excel
Excel is the world’s most used data analysis tool and that’s in part due to how easily it allows you to bring in data from all types of sources. You can go online and copy a web page and paste it into Excel, and it won’t complain nor give an error. You can even paste an image into Excel; in fact, it is difficult to find what you can’t copy and paste into Excel. The built-in flexibility of Excel makes it a very beginner-friendly tool.
The following screenshot shows an example of copying a table of populations by country from https://en.wikipedia.org/wiki/List_of_countries_by_population_(United_Nations) and pasting it into Excel:
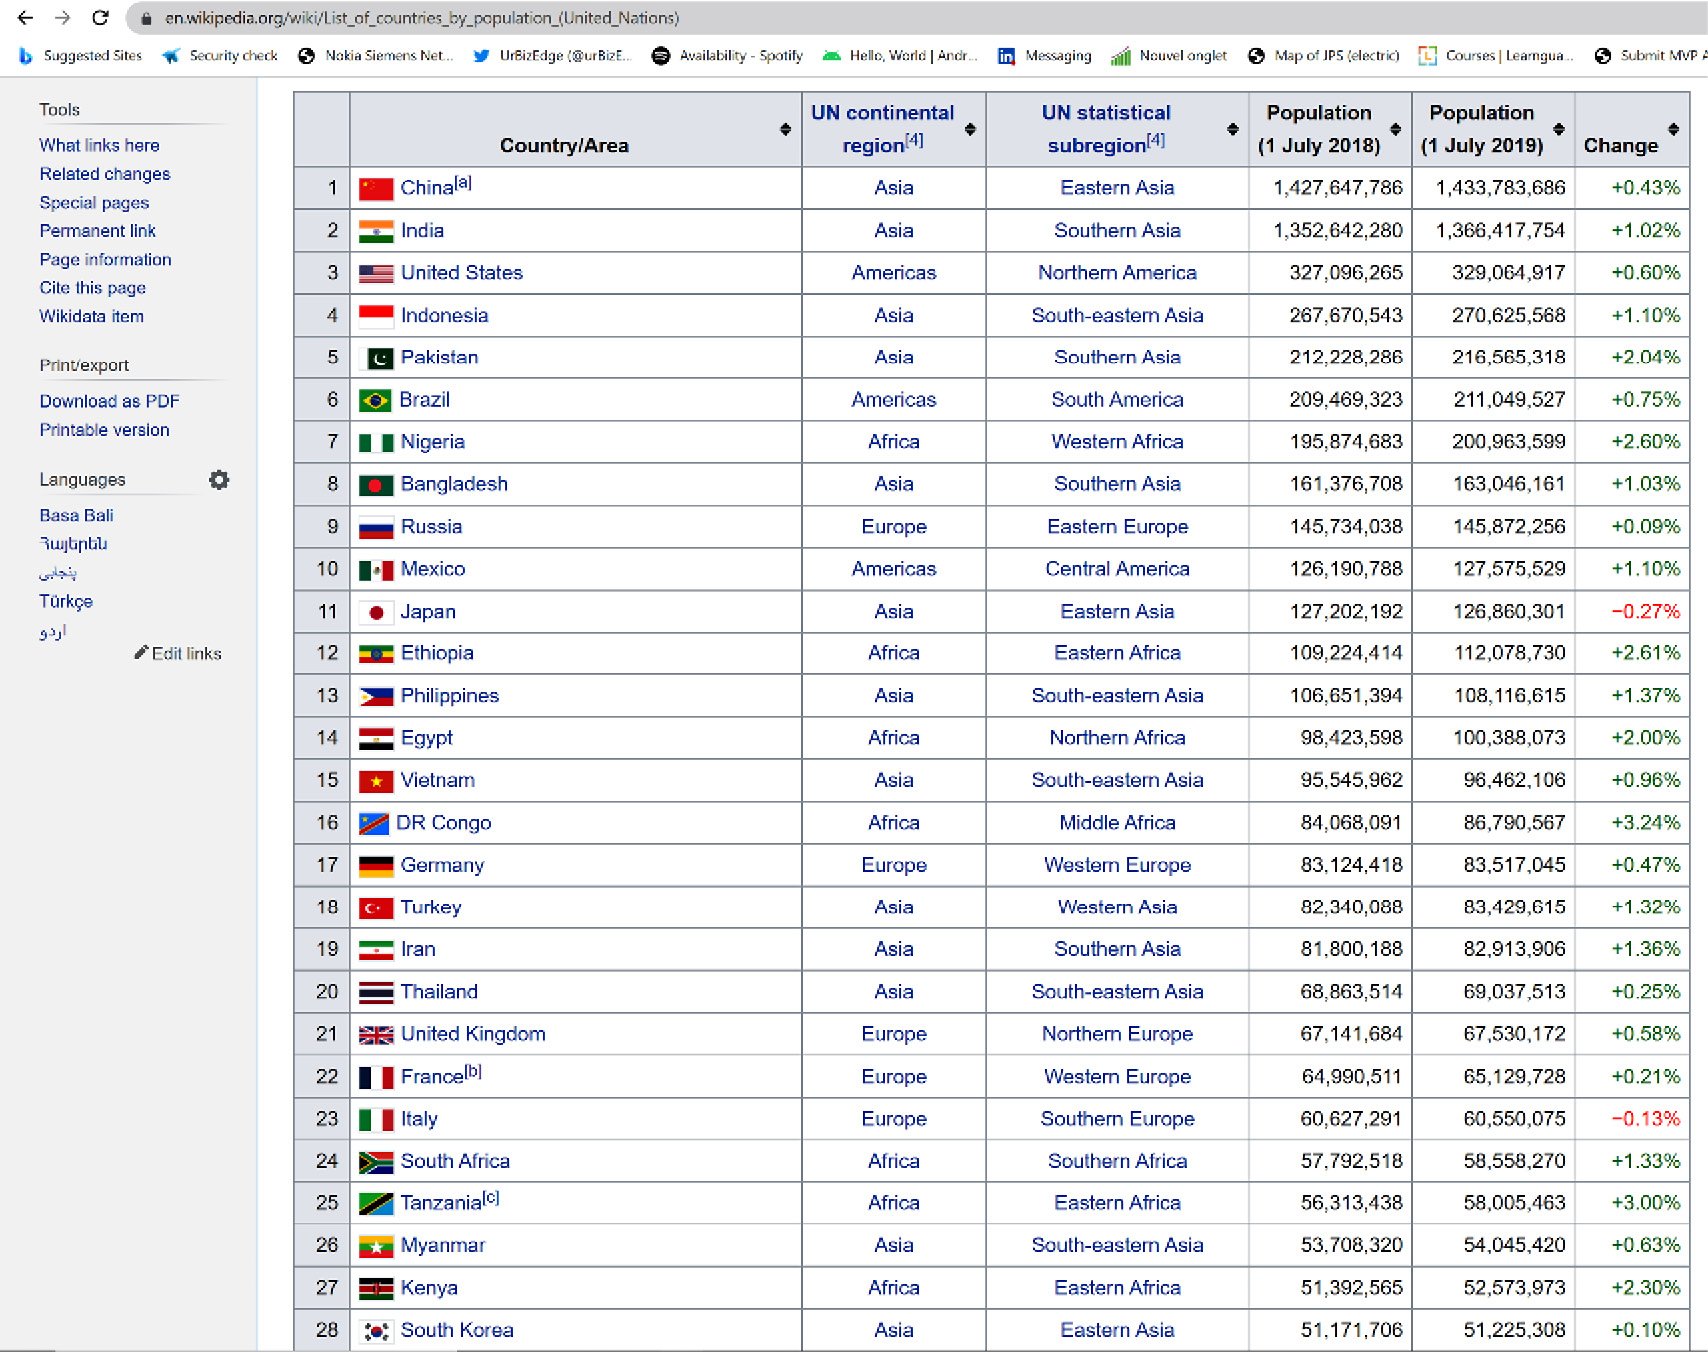
Figure 3.1 – Web page of countries and their populations
And yes, the desired goal of having a copy of the data in Excel seems to have been achieved here:
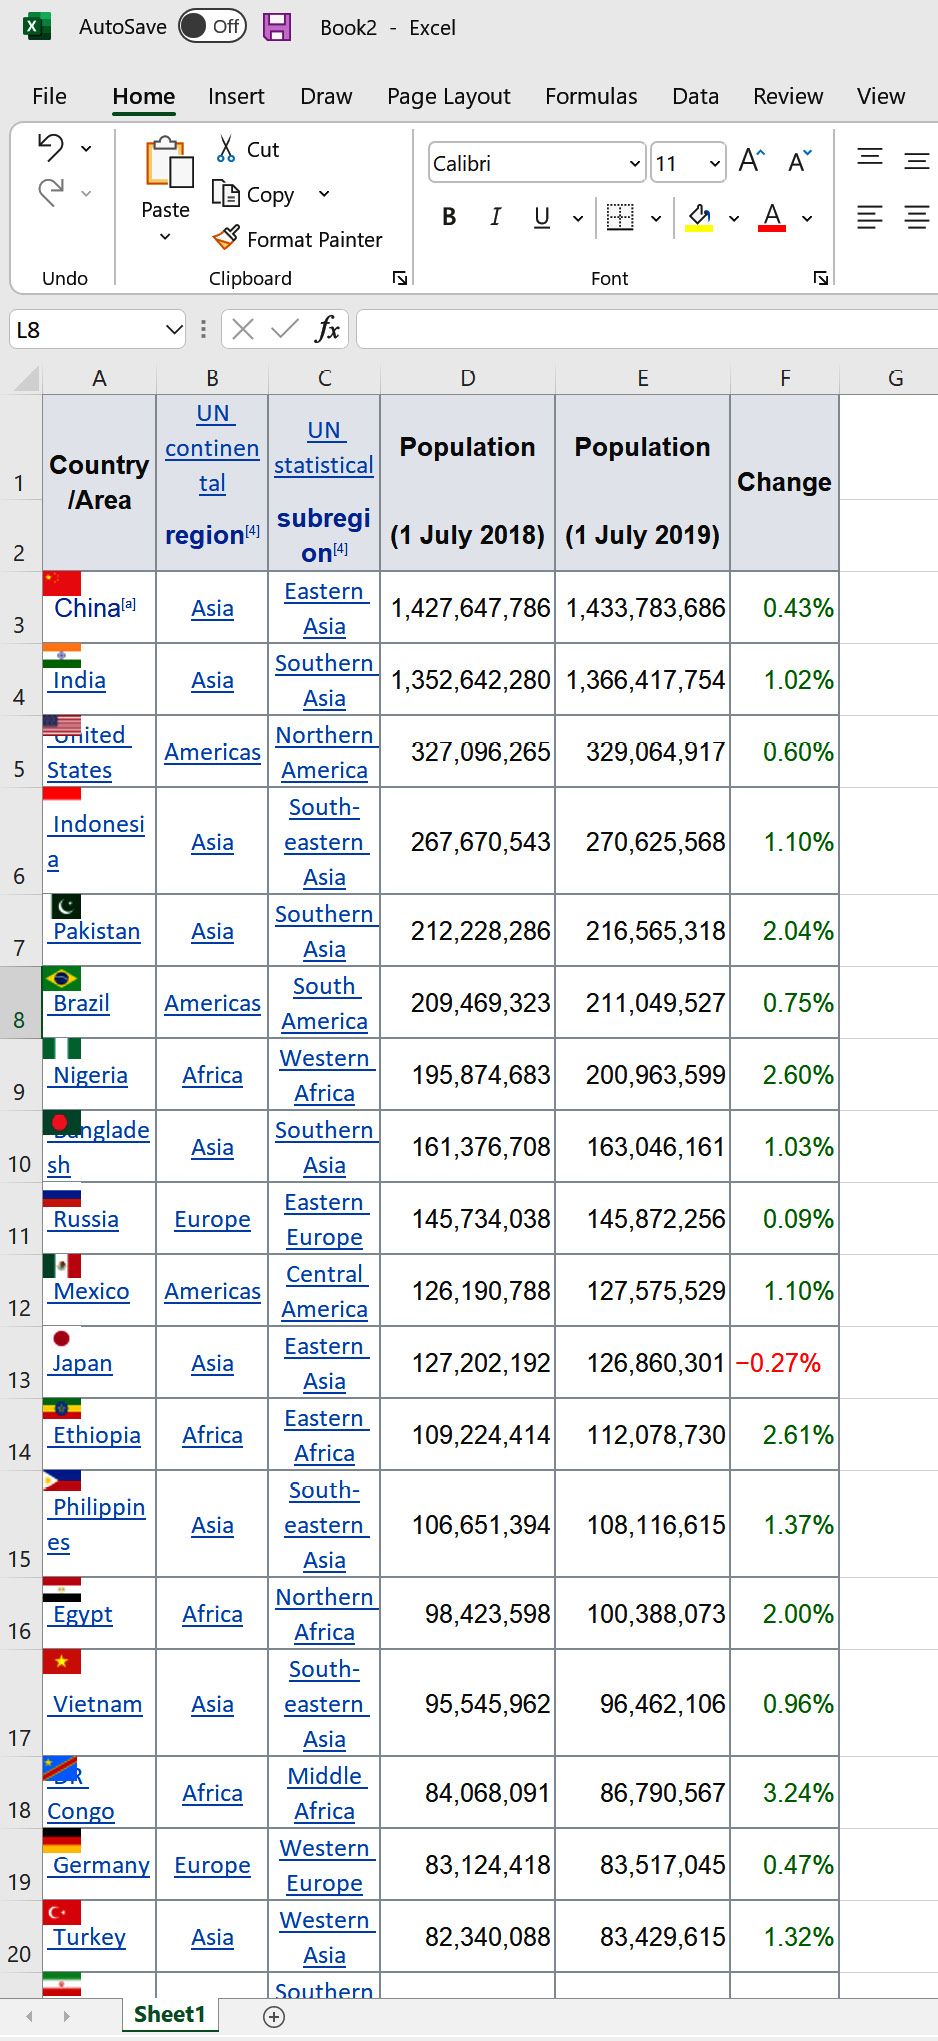
Figure 3.2 – The web page pasted into Excel