


Important tips
At the first launch of Power Query in Excel, you may notice that the formula bar is not visible. You can easily enable it by going to the View menu and checking the checkbox beside Formula Bar. See the following screenshot:
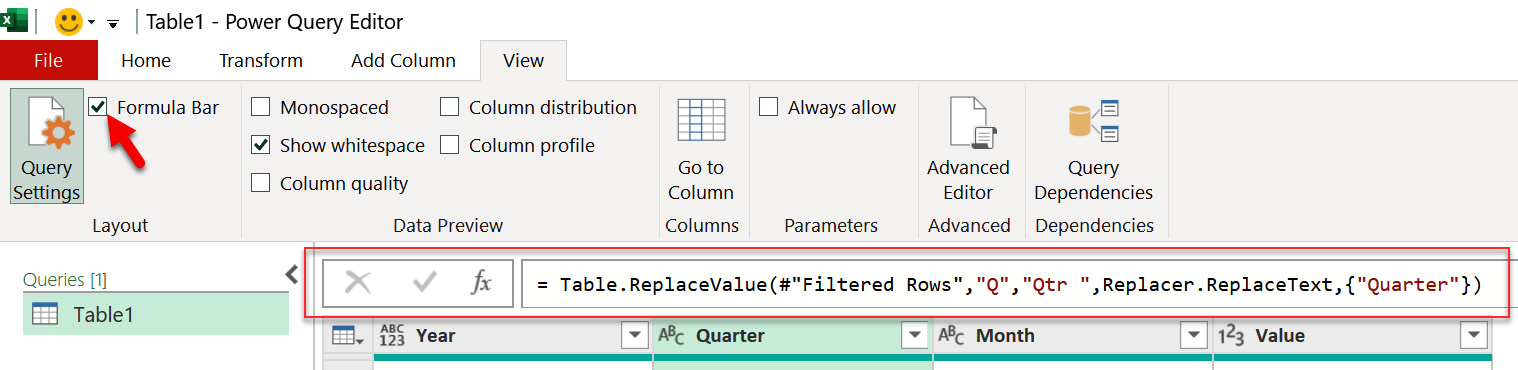
Figure 4.56 – Enabling the formula bar in Power Query
Most of the commonly used transformations can be easily accessed upon right-clicking on the column name. See the following screenshot:
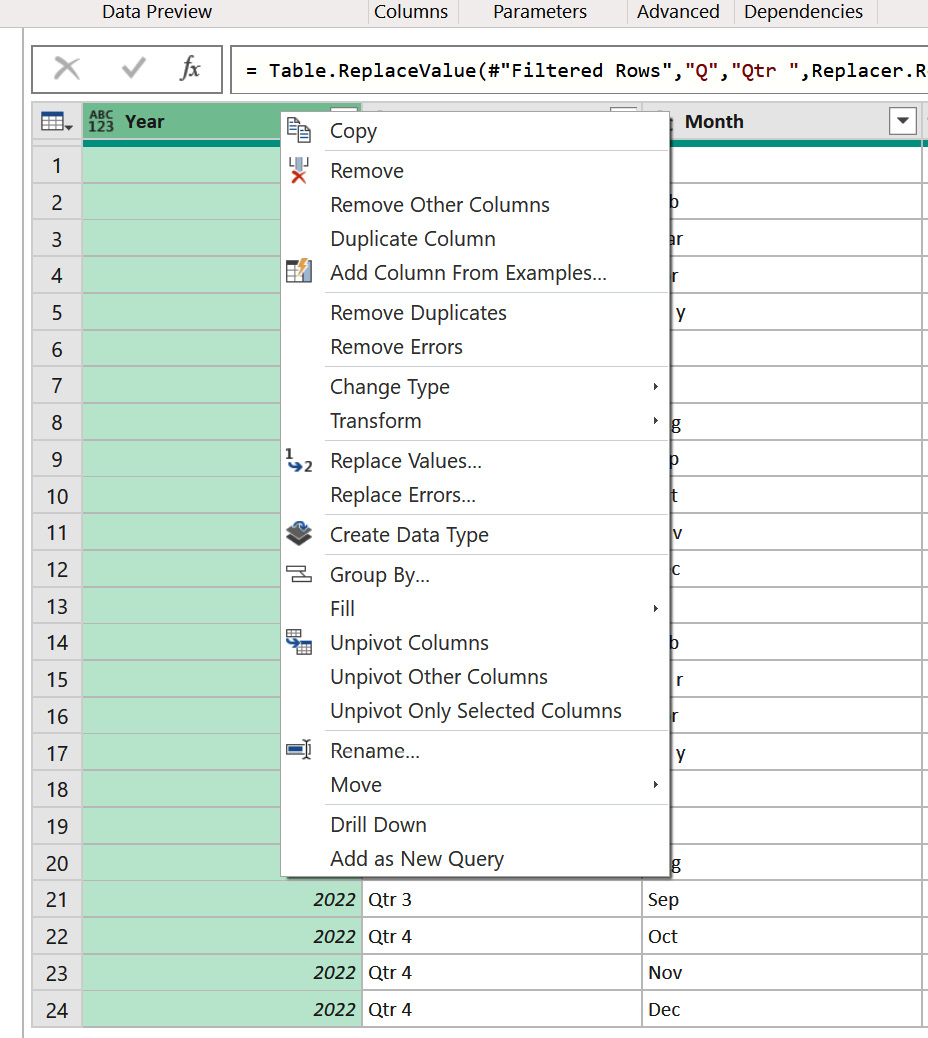
Figure 4.57 – Right-clicking on a column to reveal common transformations
Always set the column data type. It might not cause you much trouble in Excel, but as you begin to apply your Power Query knowledge in Power BI and other platforms, you will face issues that are linked to improperly set column data types. A quick way to set the data types for all columns at once is to use Detect Data Type under the Transform menu after selecting all the columns. See the following screenshot: