


Appending data from multiple sources in one data table
A common issue you will face as you work with data from multiple sources is the need to consolidate data that is best used as a single table. An example that we will walk through is the consolidation of departmental tables that will best serve our analytical purpose if modeled into just one table. You can access the practice file in the companion folder for this book. The filename is AdventureWorks - Employees by Dept.xlsx, and it is a collection of employees by department in a fictitious company, AdventureWorks Limited.
The following screenshot shows the data in the practice file:
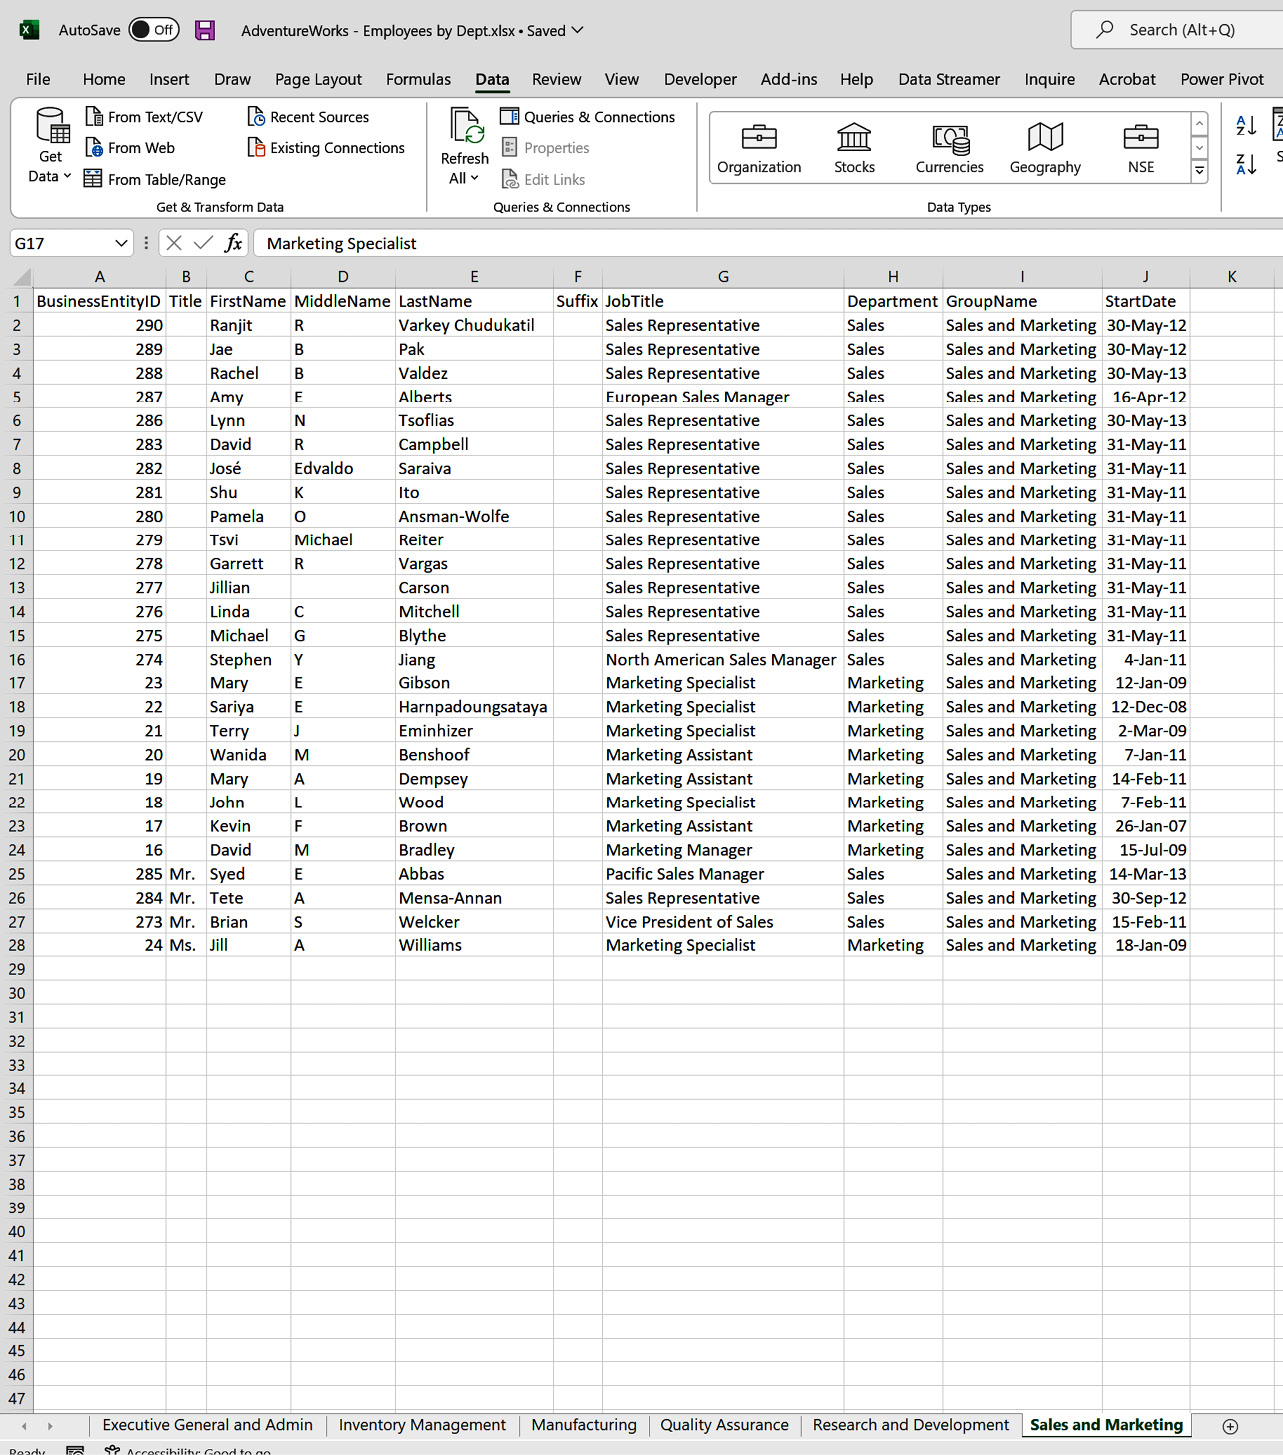
Figure 4.24 – An overview of table of employees by department
How do we go from these multiple tables of employees to one consolidated table of all employees? With Power Query, this is easily achieved by using Append Queries.
You start by pulling in all the tables in the Excel file into Power Query. In this...