


Building the HR manpower dashboard
We will pick up from where we left off in the previous chapter when we built the data model, like the one in the following screenshot:
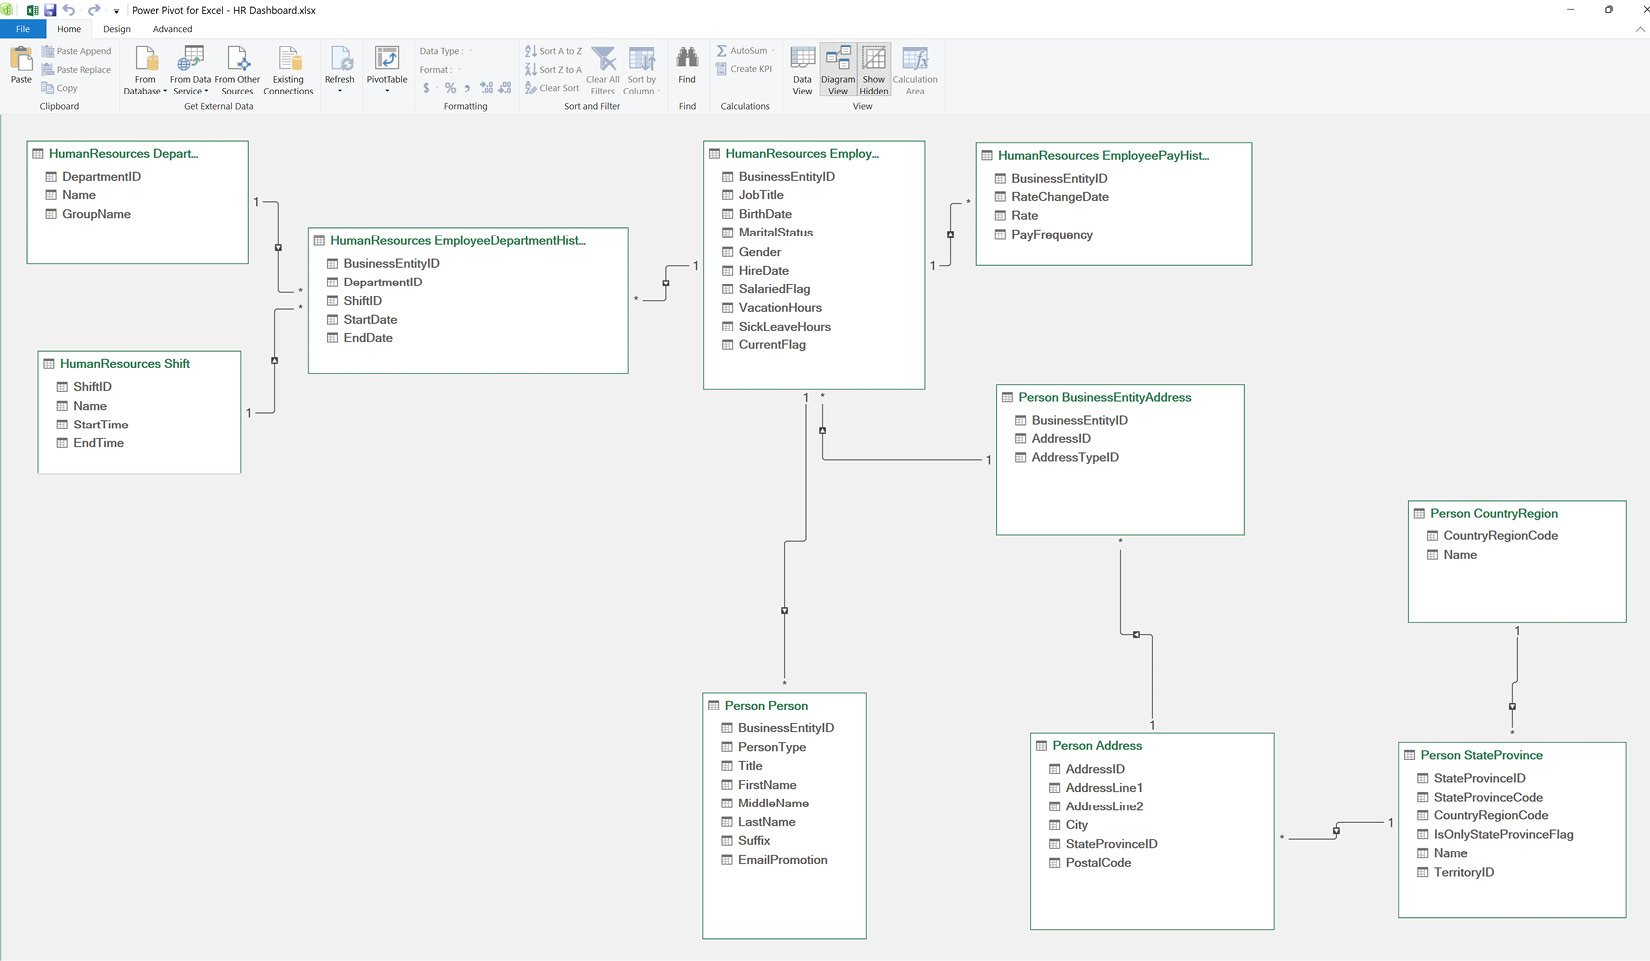
Figure 11.1 – An overview of the HR dashboard data model
We are going to build an HR manpower dashboard that will look like the one in the following screenshot:
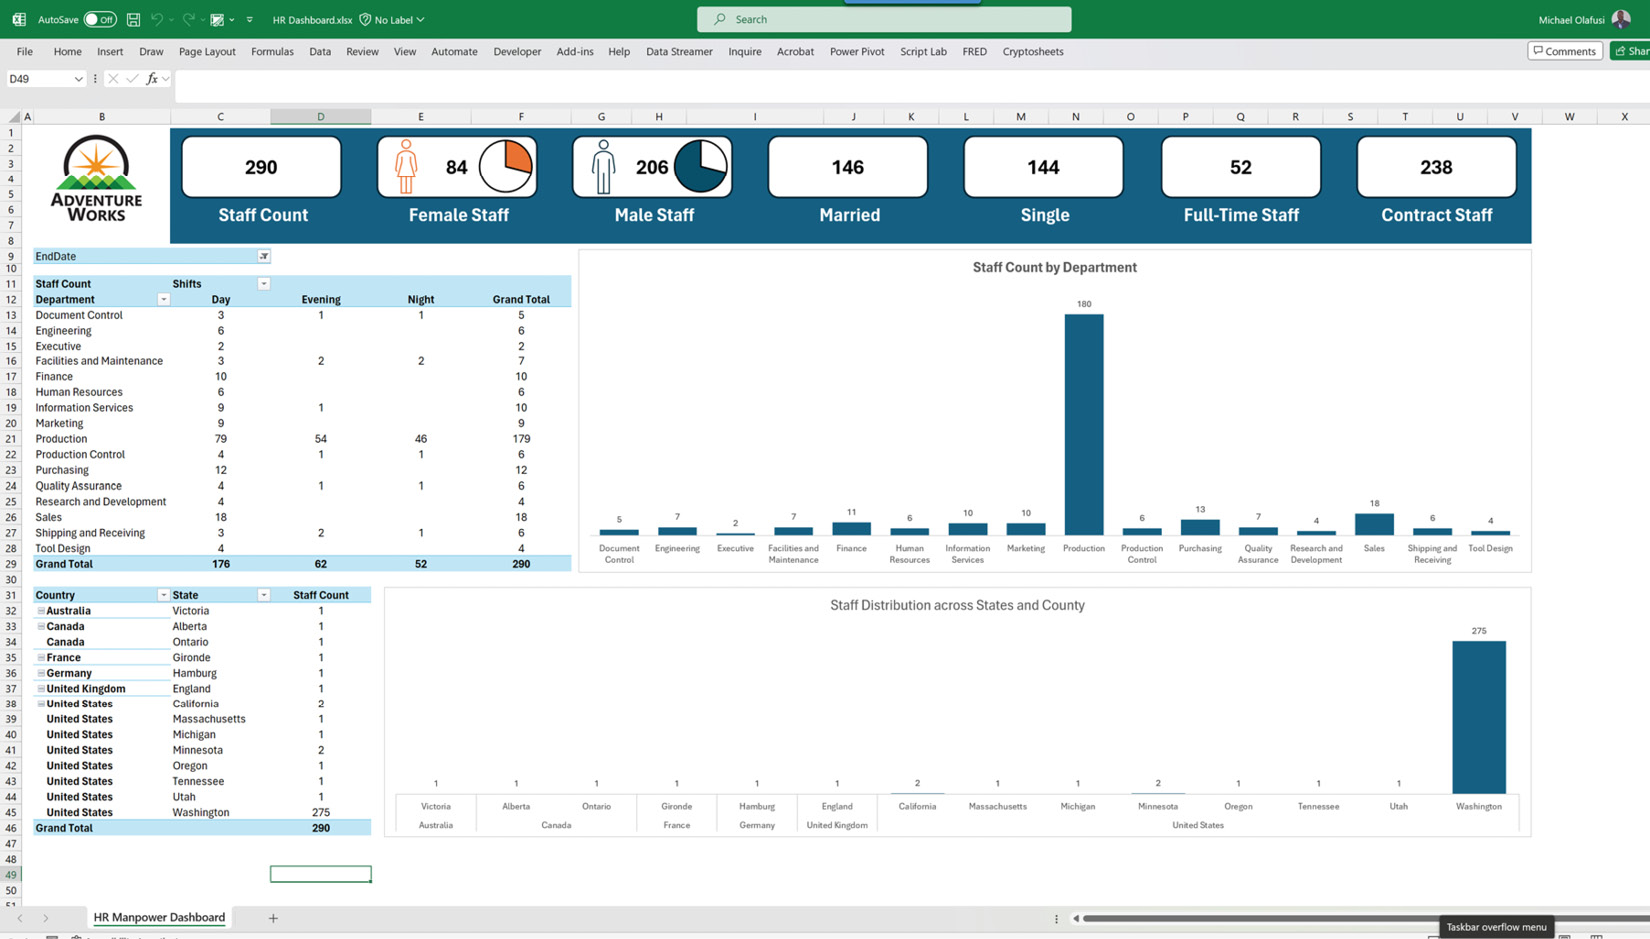
Figure 11.2 – An overview of a snapshot of the dashboard to be built
To build this dashboard, we will use the following components in Excel:
- A PivotTable to generate the interactive tables
- A PivotChart to create two column charts in the dashboard
- Insert a picture to add the company logo
- Shapes and icons to create single-value cards at the top of the dashboard
By the time we have finished building the dashboard, you will get to experience the power that having a proper data model puts in your hands, building beautiful interactive dashboards without using complex...