Reader small image

You're reading from  Building Interactive Dashboards in Microsoft 365 Excel

Product typeBook
Published inFeb 2024
PublisherPackt
ISBN-139781803237299
Edition1st Edition
Tools
Right arrow
Author (1)
Michael Olafusi
Michael Olafusi
author image
Michael Olafusi

Michael Olafusi is a 9x Microsoft Most Valuable Professional (MVP) and a business intelligence consultant. He is the lead consultant and founder of MHS Analytics Inc. in Canada and UrBizEdge Limited. He has been consulting for clients across North America, Europe, and Africa on data analysis, business intelligence, and financial modeling for the past 10 years. Outside of his consulting business, he is a member of Rotary and the Southern Cruisers Riding Club (SCRC) Chapter 373. He is a proud member of the Canadian Red Cross friendly calls volunteer team. He is also a faculty member at WorldQuant University, USA.
Read more about Michael Olafusi

Right arrow

Getting Comfortable with the 19 Excel Charts

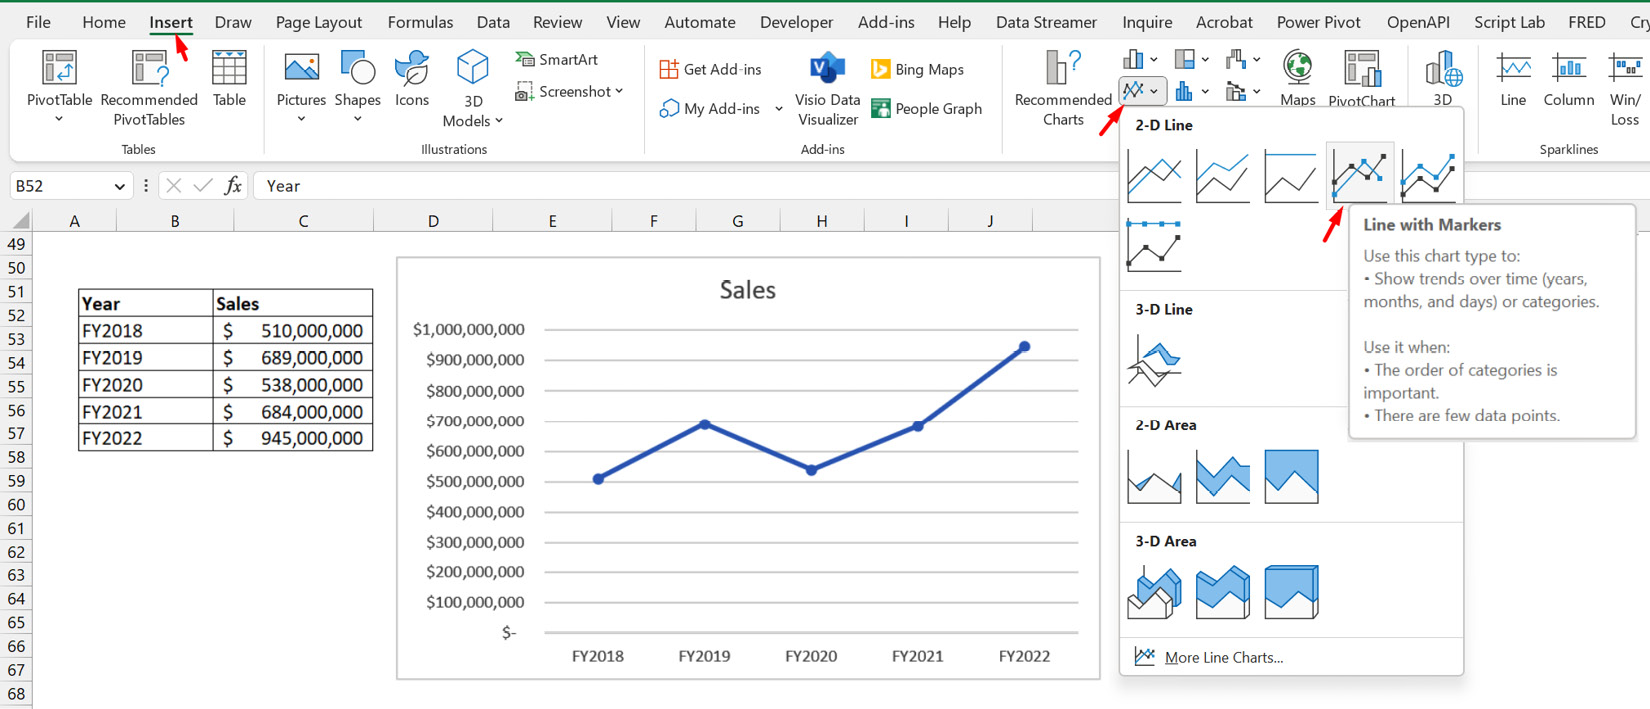
Excel 365 has 19 chart types, and some of these charts were added as recently as six years ago. Charts are very important and form the core of most of the data visualization that happens within Excel. Building dashboards in Excel requires ample use of visualization tools, from charts to slicers and conditional formatting.

For over 20 years, Excel had no more than 11 chart types, but the number of charts has almost doubled in the last seven years. This is a reflection of the very important role charts now play in modern reports and dashboards. A lot of charts that used to be very difficult to create in Excel are now possible.

The goal of this chapter is to give you the requisite knowledge of the different charts within Excel, what each type is best used for, and how to create beautiful charts that powerfully present the insights of your reports or dashboards.

In this chapter, we will be covering all 19 chart types:

  • Column...

Column chart

The column chart is the most used chart type in Excel. It is a great visual representation of numerical values against a few categories or labels, depicting the numerical values with vertical bars against a horizontal axis. Think of showing sales value against regions, or expenses incurred against expense categories. As long as the categories to represent visually are not over a dozen, a column chart often works nicely. It has the dual advantage of being easy to create and easy to read. The following screenshot shows an example of a column chart showing sales across five regions:

Figure 8.1 – Column chart showing company sales across five regions

Figure 8.1 – Column chart showing company sales across five regions

Once you’ve decided to go with a column chart, based on your data and the insights you want to graphically present, the next important task is the design of the chart. A column chart can be created as a clustered column chart, a stacked column chart, or a 100% stacked column chart. Oftentimes...

Bar chart

A bar chart is a variant of a column chart – same use case and same design options. The main difference is that a bar chart has horizontal bars while a column chart has vertical bars. Bar charts can be a more user-friendly chart to use when you have long axis labels and making them show in the horizontal orientation is far better than having them slant at an angle. In Figure 8.9, you’ll see how a bar chart handles long axis labels compared to how a column chart handles the same in Figure 8.10:

Figure 8.9 – Good handling of long axis labels by a bar chart

Figure 8.9 – Good handling of long axis labels by a bar chart

The handling of the same long axis label by a column chart is shown as follows. Do, however, note that if the width of the column chart is made wider, it may eventually display the labels horizontally as preferred:

Figure 8.10 – Poor handling of long axis labels by a column chart

Figure 8.10 – Poor handling of long axis labels by a column chart

Another advantage of a bar chart is that for instances when...

Line chart

A line chart shows trends – how a metric performs over a date/time range. It is, perhaps, the second most used chart after the column chart. It’s the same process you’re already familiar with for creating column and bar charts. It also has the clustered, stacked, and 100% stacked options. Figure 8.16 shows an example of a line chart to visualize yearly sales for a company:

Figure 8.16 – Line chart of yearly sales

Figure 8.16 – Line chart of yearly sales

You will notice that, in addition to a plain line chart option, there’s a Line with Markers option. We have selected the clustered line with markers option for the chart in Figure 8.16.

Something to note about the line chart is that the trendline chart element display option it has can be more relevant than in the column and bar charts. Trendlines are meaningful for seeing the general trend of performance over time, so it is naturally relevant for line charts that already show the performance of...

Area chart

An area chart is essentially a line chart with the section below the line shaded or color-filled. This can be very useful when you want to emphasize both the absolute value of a time series and the trend pattern. The distinct fill below the line gives it a peak-and-trough design that makes it easy for users to recognize the absolute performance alongside the trend. The following screenshot shows an area chart for the same yearly sales data we plotted a line chart on earlier:

Figure 8.20 – Area chart of sales over a period

Figure 8.20 – Area chart of sales over a period

Things can be a bit tricky with using area charts for two or more metrics. See Figure 8.21 of the area chart of sales and expenses. Notice that the user could be confused about the actual value of sales and likely interpret it wrongly as it is stacked on the expense chart:

Figure 8.21 – Area chart of sales and expenses

Figure 8.21 – Area chart of sales and expenses

We will move on, now, to another chart.

Pie chart

A pie chart is a chart used to show the relative (often percentage-wise) breakdown of a measure by related categories. An example is a pie chart of sales broken down by contributing regions, as shown in the following screenshot:

Figure 8.22 – Pie chart of sales by region

Figure 8.22 – Pie chart of sales by region

An obvious problem with the pie chart is that the default design you get from Excel is not user-friendly. It has two major problems: it gives no clear indication of the values of each category and you have to match the colors to the categories. However, there is a quick fix. Select the chart, go to Chart Design, click on Quick Layout, and select Layout 1. The outcome is shown in Figure 8.23. Notice that the two issues mentioned earlier with the default chart have been addressed in this layout choice. The values are visible and the categories have their names displayed on their pie piece:

Figure 8.23 – Pie chart showing quick layout improvement

Figure 8.23 – Pie chart showing quick layout improvement...

Doughnut chart

A doughnut chart is like a pie chart with a big hole in the center. So, it is technically the same chart with applicable settings. The following screenshot is a doughnut chart of the same regional sales data used to demonstrate a pie chart:

Figure 8.26 – Doughnut chart showing regional sales

Figure 8.26 – Doughnut chart showing regional sales

Just like the pie chart, the default doughnut chart suffers some usability issues: no visible values for the categories and a color matching task. We can fix the issue by setting the layout to Layout 1 as we did for the pie chart. See Figure 8.27 for the outcome:

Figure 8.27 – Changing the default layout of the doughnut chart

Figure 8.27 – Changing the default layout of the doughnut chart

Every other point we covered about the pie chart also applies to the doughnut chart. So, we will move on to the next chart.

XY (scatter) chart

The XY (scatter) chart, which we will begin to refer to as a scatter chart, is a relationship plot chart. It plots the relationship between two variables: the independent (X) variable and the dependent (Y) variable. A scatter chart is more popular in the research and academic space than in the business domain because most business users are looking for the performance of known metrics rather than trying to find the relationship between two metrics. So, you have to be careful when using this chart in the business domain: you should be able to confirm that the report users don’t have a well-established interpretation of the relationship between the metrics and that there is business value in showing how the two metrics are related.

One more important thing to note when using a scatter chart is that it is a values-only chart, meaning the horizontal axis is not used to display labels but numerical values. You should never use a scatter chart to plot values...

Bubble chart

A bubble chart is actually an XY (scatter) chart with a variable size dot marker. Some even consider it as an XYZ chart, which helps you visualize the relationship between three different variables.

Just like a scatter chart, you can only plot true numerical values and it is best to have them arranged as an X series before the Y series before the third (Z) series. The following screenshot shows a bubble chart for ice cream sales against temperature, and is inclusive of a third series, average order quantity:

Figure 8.31 – Bubble chart of ice cream sales and order size by temperature

Figure 8.31 – Bubble chart of ice cream sales and order size by temperature

The major concern with a bubble chart is whether the audience will understand the interpretation easily. If you have an unsophisticated audience and you won’t be there to explain the charts to them, you might want to use another easier-to-read chart.

And that’s it about bubble charts; they are very much like scatter charts, so all we...

Stock chart

A stock chart is a niche chart in Excel and is mostly useful for displaying the price movement summary of financial market securities. It requires a strict table structure and may not be easy to read for those not accustomed to it.

Stock charts accept a four-table structure:

  • High-Low-Close
  • Open-High-Low-Close
  • Volume-High-Low-Close
  • Volume-Open-High-Low-Close

Figure 8.32 shows a stock chart with the Open-High-Low-Close table structure. The bars can be set to different colors:

Figure 8.32 – Stock chart for the Open-High-Low-Close data series

Figure 8.32 – Stock chart for the Open-High-Low-Close data series

We will move now to the next chart.

Surface chart

A surface chart is another niche chart used mostly in the research and academia domain. It is used to plot the relationship between two independent variables and one dependent variable. Figure 8.33 shows sample data and the corresponding surface chart plot:

Figure 8.33 – Surface chart example

Figure 8.33 – Surface chart example

It is seldom used in the business domain and can be very difficult to interpret. Personally, I have only had to use it for visualizing a heuristic algorithm for academic purposes. It is predominantly used in the research and academic domain for visualizing three-dimensional relationships.

We will move on to the next chart.

Radar chart

A radar chart is a chart used for comparing different items across multiple range-bound numerical criteria. It is also known as a spider chart because of the weblike form it has. It is a very useful chart for decision-making, based on known criteria, with scores assigned to the items compared across each criterion.

An example of a relevant use of a radar chart is a comparison of two or more vendors based on criteria, such as quality of service, cost of service, support offering, and years of experience. A radar chart is perfectly suited for such comparisons, and the following screenshots show us what it looks like:

Figure 8.34 – Radar chart for vendor comparison

Figure 8.34 – Radar chart for vendor comparison

You will, however, want to be careful that you do not confuse the report users. If you sense that your report users will struggle to get the insights presented by the radar chart, you can switch to the more familiar column or bar chart to convene the same insights.

We will...

Treemap chart

A treemap chart is a hierarchical chart that is relatively new in Excel. It can be used in place of a clustered column chart for just one set of values for a metric. It always arranges the category values in descending order. It also has the advantage of being space-optimal, adjusting very well to size changes. The following screenshot is an example of a treemap showing regional sales:

Figure 8.35 – Treemap chart of regional sales

Figure 8.35 – Treemap chart of regional sales

Notice that the arrangement of the category values in the chart is in descending order and not in their natural order in the source table. That can be useful in a dashboard of changing data values, as it will always rearrange the category values in descending order.

Lastly, if we reduced the width of the chart, it would reshape its entire plot to make good use of the new size dimensions assigned to it. See the following screenshot for this size adjustment:

Figure 8.36 – Resized treemap chart

Figure 8.36 –...

Sunburst chart

Sunburst is another hierarchical chart, like the treemap chart, but it is meant to replace pie charts in some situations. Its hierarchical behavior and the ability to show multiple levels of granularity make it well suited for data that has two or more detail levels.

An example is to visualize sales by region broken down into constituent countries. See the following screenshot as an example:

Figure 8.37 – Sunburst chart of sales by country and region

Figure 8.37 – Sunburst chart of sales by country and region

Notice how the regions and countries are not arranged in the same order as in the table; the largest values appear first. It also shows the regional level and then the country level in the same plot.

And that is it for the sunburst chart; we will move on to the next chart.

Histogram chart

The histogram chart is a niche chart mostly used to visualize the distribution of a set of values. If you have income data of over 200,000 people in your market catchment area, you might want to plot a histogram chart on the data to see the income brackets most people fall into. So, if you have sales data for the last quarter and you are trying to help the business set an appropriate order volume at which a discount promotion should kick in, a histogram will come in handy by showing you what that order volume target should be.

In Figure 8.38, we see a histogram used to visualize the distribution of order value across sales made within a particular period. This can be useful for a business to understand customers’ purchase patterns:

Figure 8.38 – Histogram to show sales order value distribution

Figure 8.38 – Histogram to show sales order value distribution

That will be it for histograms; we will move on to the next chart.

Box and whisker chart

The box and whisker chart is a niche chart for visualizing statistical measures of central tendency – mean, median, outliers, and quartiles. This can be very difficult to read for an audience not accustomed to the chart and the measures, but in an academic or research environment, it may be the only way to convey all those vital details in one plot.

The following screenshot shows a box and whisker chart plot of a daily series of sales order values showing the outliers, mean, median, and quartiles. It can be a very rich source of insights for a statistician when describing order patterns:

Figure 8.39 – Box and whisker chart of daily order values

Figure 8.39 – Box and whisker chart of daily order values

That brings us to the end of the box and whisker chart; we will move on to the next chart.

Waterfall chart

A waterfall chart is a movement visualization chart, used very frequently in the finance domain to show cash flow or asset value movement from a period start to a period end. It is easy to read and can be the best way to present insights that involve showing a period start value, value changes, and a period end value.

Figure 8.40 is an example of a waterfall chart, showing a company’s annual cash flow position inclusive of monthly movements:

Figure 8.40 – Waterfall chart to show cash flow movements

Figure 8.40 – Waterfall chart to show cash flow movements

One thing that you need to set every time you create a waterfall chart is the opening and closing bars differently from the movement bars. It is very easy to do. Just click twice on the opening or closing bar, right-click, pick Format Data Point, and then tick Set as total. See Figure 8.41 for an illustration of the steps:

Figure 8.41 – Setting the opening and closing bars in a waterfall chart

Figure 8.41 – Setting the opening and closing bars in a waterfall chart...

Funnel chart

A funnel chart is a niche chart showing the linearly linked stage performance for a metric. A classic example is the use of a funnel chart by marketing teams to show sales funnel conversion performance.

Figure 8.42 is an example of a funnel chart showing the sales conversion for a multi-stage marketing campaign:

Figure 8.42 – Funnel chart showing the performance of an email marketing campaign

Figure 8.42 – Funnel chart showing the performance of an email marketing campaign

Funnel charts are easy to create and easy to understand even for non-sophisticated users. The trick is to ensure that you are using it to show insights about linked processes where each process will always have a value that is not greater than its preceding process.

That brings us to the end of funnel charts. We will move on to another chart.

Filled map chart

A filled map chart is a map chart that carves out the coverage areas of each geographical location supplied and uses a dark-to-light color fill to present the values for each location. It is a good chart to use for location-based data as it adds the geographical positioning insight that is lost when other chart types are used.

Figure 8.43 is an example of a filled map chart showing the sales for a retail company across different Canadian provinces:

Figure 8.43 – Sales by province on a filled map chart

Figure 8.43 – Sales by province on a filled map chart

That wraps it up for the filled map chart. We will move on to the last chart type.

Combo chart

A combo chart is a combination of more than one chart type, and it is usually one of the following combinations:

  • Line and column charts combination
  • Line and bar charts combination
  • Area and column charts combination
  • Area and bar charts combination
  • Any combination of line, bar, column, and area charts

Combo charts are useful for showing multiple insights without needing to plot two separate charts. You could combine a column chart of monthly sales with a line chart of profit margin. This ensures the user focuses on the whole message intended.

Figure 8.44 shows a combo chart of annual sales and operating profit margin:

Figure 8.44 – Combo chart

Figure 8.44 – Combo chart

Combo charts require that you specify which chart type each data series is plotted as and also indicate the primary axis or secondary axis. With that, we have come to the end of combo charts.

Summary

This chapter has been a fairly long one, as we have covered all 19 chart types you will come across in modern Excel versions. It is a commendable feat to master all 19 charts but it is not recommended to use them all in your report creation. The first four charts we covered are going to be your go-to charts: column chart, bar chart, line chart, and pie chart. They are versatile and easy to interpret by all classes of users. Then, a few charts are great to try out occasionally: filled map chart, sunburst chart, area chart, waterfall chart, treemap chart, and funnel chart. The rest must be used, if ever, with a great deal of caution as they can prove unreadable for untrained audiences.

The biggest takeaway we want you to have from this chapter is that charts are extremely important in modern-day reports and dashboard creation. You have to be good at selecting the right charts and ensuring the design looks good.

In the next chapter, we will cover non-chart visuals. You will...

lock icon
The rest of the chapter is locked
You have been reading a chapter from
Building Interactive Dashboards in Microsoft 365 Excel
Published in: Feb 2024Publisher: PacktISBN-13: 9781803237299
Register for a free Packt account to unlock a world of extra content!
A free Packt account unlocks extra newsletters, articles, discounted offers, and much more. Start advancing your knowledge today.
undefined
Unlock this book and the full library FREE for 7 days
Get unlimited access to 7000+ expert-authored eBooks and videos courses covering every tech area you can think of
Renews at $15.99/month. Cancel anytime

Author (1)

author image
Michael Olafusi

Michael Olafusi is a 9x Microsoft Most Valuable Professional (MVP) and a business intelligence consultant. He is the lead consultant and founder of MHS Analytics Inc. in Canada and UrBizEdge Limited. He has been consulting for clients across North America, Europe, and Africa on data analysis, business intelligence, and financial modeling for the past 10 years. Outside of his consulting business, he is a member of Rotary and the Southern Cruisers Riding Club (SCRC) Chapter 373. He is a proud member of the Canadian Red Cross friendly calls volunteer team. He is also a faculty member at WorldQuant University, USA.
Read more about Michael Olafusi