


Building the sales performance dashboard
We will build on the data model we created in the previous chapter for the sales dashboard, and you can see what it looks like in the following screenshot:
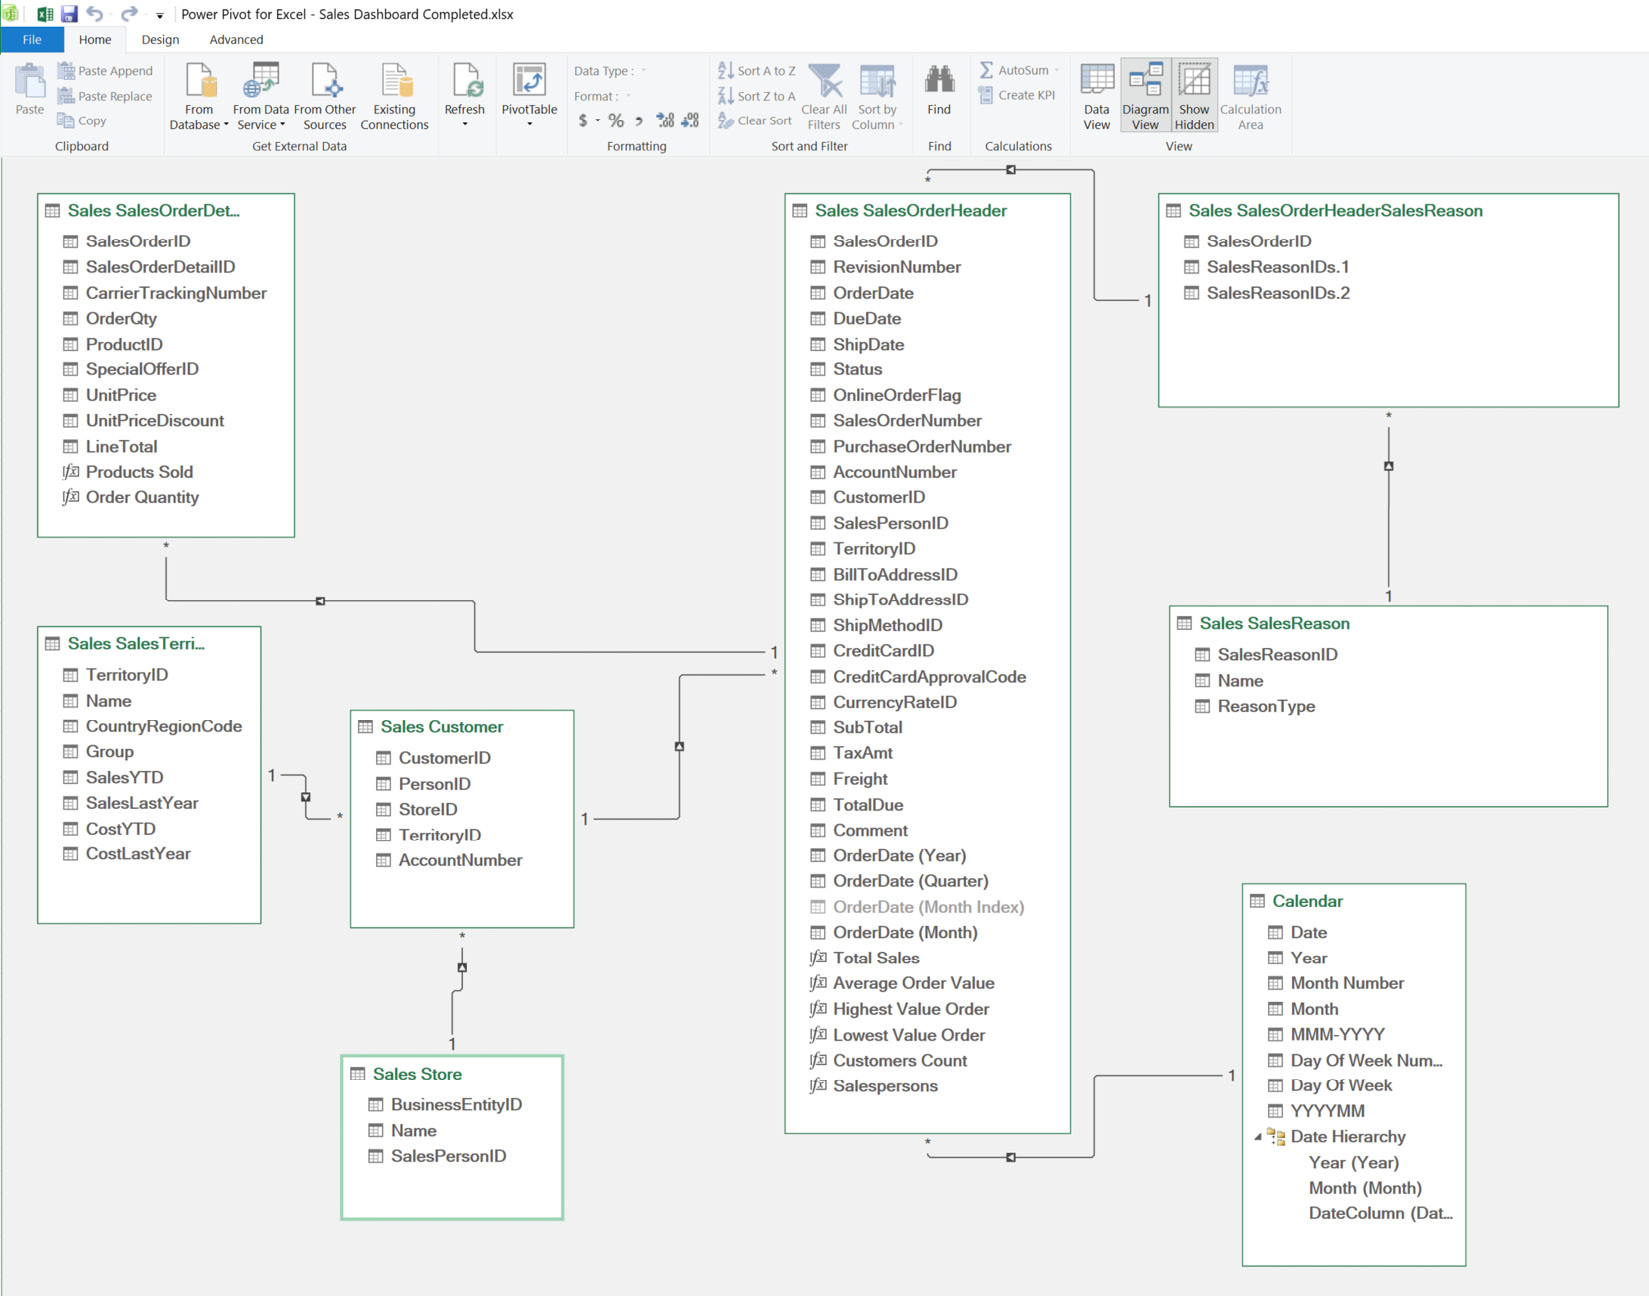
Figure 11.14 – An overview of the sales dashboard data model
We will take the steps we followed in creating the HR dashboard – inserting PivotTables, inserting PivotCharts, and inserting illustrations (pictures and shapes). However, in addition to those steps, we will insert slicers, insert a timeline, and create calculation measures. So, this will involve more steps than the HR dashboard, and you will enjoy taking these new steps, as they will empower you with the knowledge to create very robust dashboards that meet business decision makers’ needs.
We will start by creating the calculation measures.
Creating measures
Measures are formulas you create within a table in Power Pivot to output one result for the entire table. They are...