Reader small image

You're reading from  Building Interactive Dashboards in Microsoft 365 Excel

Product typeBook
Published inFeb 2024
PublisherPackt
ISBN-139781803237299
Edition1st Edition
Tools
Right arrow
Author (1)
Michael Olafusi
Michael Olafusi
author image
Michael Olafusi

Michael Olafusi is a 9x Microsoft Most Valuable Professional (MVP) and a business intelligence consultant. He is the lead consultant and founder of MHS Analytics Inc. in Canada and UrBizEdge Limited. He has been consulting for clients across North America, Europe, and Africa on data analysis, business intelligence, and financial modeling for the past 10 years. Outside of his consulting business, he is a member of Rotary and the Southern Cruisers Riding Club (SCRC) Chapter 373. He is a proud member of the Canadian Red Cross friendly calls volunteer team. He is also a faculty member at WorldQuant University, USA.
Read more about Michael Olafusi

Right arrow

Power Query: the Ultimate Data Transformation Tool

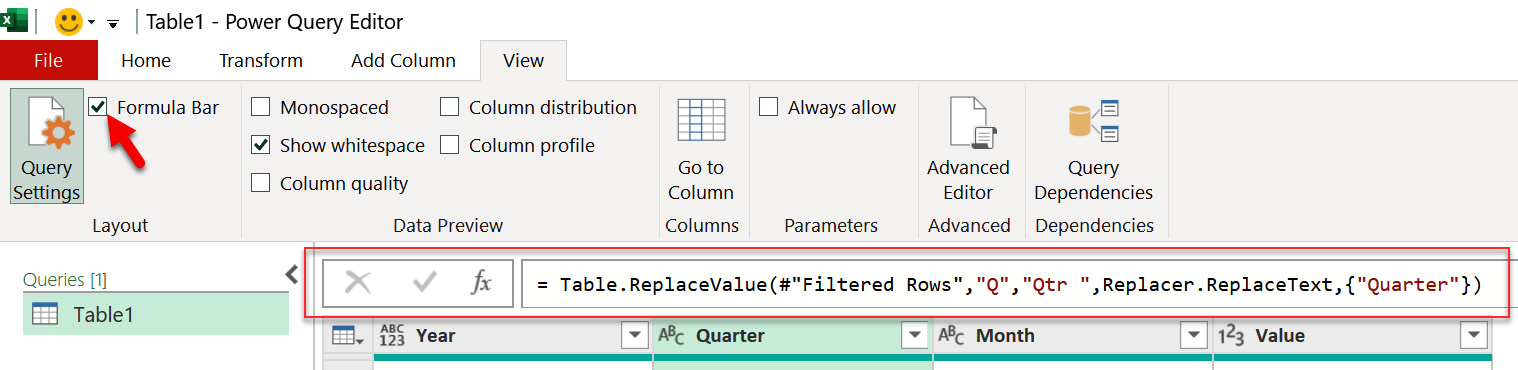
The most important update to Excel in the last 12 years has been Power Query. Power Query is a powerful data connectivity and data transformation tool. Its purpose is to enable report and dashboard builders that connect directly to the data they need, wherever it is stored, transform the data as desired, and have a repeatable process of generating updated reports and dashboards as the underlying data changes.

Much of what Power Query makes possible out of the box for the modern Excel user is transformations that used to be only possible via Visual Basic for Applications (VBA) code in Excel. There are daily, weekly, and monthly reports that were not possible to fully automate in earlier versions of Excel without using VBA but are now possible by using Power Query. Power Query makes it possible to build fully automated dashboards in Excel without writing VBA code or complex formulas.

In this chapter, we will get you well acquainted...

Introduction to Power Query

Power Query was officially released by Microsoft in 2013 as an add-in that was installable in Excel 2010 and Excel 2013. It was originally designed to help Excel users connect to data directly, especially data not housed in an Excel file. Examples of such data are relational database tables, SharePoint lists, text files, and cloud data sources. It creates a pathway to connect to these types of data, transform the data, and then load the data into Excel sheets, tables, or PivotTables. In essence, Power Query is an Extract, Transform, and Load (ETL) tool.

Power Query has changed a lot since the first version. In Excel 2010 and Excel 2013, it had a dedicated menu and was a Component Object Model (COM) add-in that could be enabled or disabled after installing the Power Query add-in. The following screenshot shows what it was like in the early versions in Excel 2010 and Excel 2013:

Figure 4.1 – Power Query in Excel 2013

Figure 4.1 – Power Query in Excel 2013

...

Connecting to over 100 different data sources

Power Query has connectors for over 100 different data sources. This means you can connect directly to most data sources without the need to first export the data and re-import the static export into Excel. This direct, live connection to data sources is one of the major advantages of using Power Query for report building.

However, there’s a catch with the current connector setups – their availability can be limited by the host application. This means some connectors are available for Power Query in Power BI and not available for Power Query in Excel. You can access the list of Power Query connectors on the Microsoft official page for Power Query, https://powerquery.microsoft.com/en-us/connectors/, and via this GitHub page: https://github.com/olafusimichael/B18312.

If there’s a data source you want to directly connect to and it’s in the preceding list but not available for Power Query in Excel, there’...

Transforming data in Power Query

Connecting to the data you need is a critical part of your dashboard building, and equally important is cleaning and shaping the data correctly. Power Query is Excel’s most powerful tool for data cleaning and transformation. You can easily combine data from multiple sources in Power Query using Merge Queries or Append Queries. You can remove duplicate entries, split a column into multiple columns, fill values down an empty range, fill values up an empty range, extract values from a column, unpivot a table (which might be new to Excel users who have not used Power Query before), and do many other data transformations necessary to get your data ready for analysis. Most of these transform tools can be found in the Transform menu, the Add Column menu, and the Home menu of Power Query. For convenience, if you right-click on a column name in Power Query, you will see a list of the commonly used transform tools, as shown in the following screenshot...

Appending data from multiple sources in one data table

A common issue you will face as you work with data from multiple sources is the need to consolidate data that is best used as a single table. An example that we will walk through is the consolidation of departmental tables that will best serve our analytical purpose if modeled into just one table. You can access the practice file in the companion folder for this book. The filename is AdventureWorks - Employees by Dept.xlsx, and it is a collection of employees by department in a fictitious company, AdventureWorks Limited.

The following screenshot shows the data in the practice file:

Figure 4.24 – An overview of table of employees by department

Figure 4.24 – An overview of table of employees by department

How do we go from these multiple tables of employees to one consolidated table of all employees? With Power Query, this is easily achieved by using Append Queries.

You start by pulling in all the tables in the Excel file into Power Query. In this...

Merging data from two tables into one table

There will be instances where you have data split across two tables but need them just in one table. For people with SQL knowledge, this is often achieved with an SQL JOIN clause. There are different types of joins: inner join, left outer join, right outer join, self join, cross join, and so on. In Power Query, Merge Query achieves many of these joins in a very easy-to-understand way.

As an example, we will merge data in the employees table we just worked on and a payroll table. You can access the practice files in the companion folder. The filename is Merge Data.xlsx.

Load the data from the two sheets in the file into Power Query. Go to the Home menu and click on Merge Queries as New. See the following screenshot:

Figure 4.32 – Merge Queries as New table in Power Query

Figure 4.32 – Merge Queries as New table in Power Query

In the Merge pane that comes up, select Employees Data as the first table and Payroll as the second table. The order is actually...

Common data transformations

In addition to being great at appending tables and merging tables, you will encounter many other data transformation needs that will necessitate using some of Power Query’s amazing tools. We will cover the common ones in this section.

Choose Columns

It might sound simplistic, but if you are working with tables with lots of columns and you want a quick way to select the columns you need, then you will appreciate that Power Query has a tool for just that. All you need to do is click the Choose Columns button under the Home menu and you will be presented with a window showing all the column names with a checkbox beside them. For ease of spotting the required columns, you can set the column names to be sorted from A to Z. See the following screenshot:

Figure 4.39 – Choose Columns in Power Query

Figure 4.39 – Choose Columns in Power Query

Choose Columns is a fast and convenient way to select the columns needed in a table that has lots of columns.

Keep...

Important tips

At the first launch of Power Query in Excel, you may notice that the formula bar is not visible. You can easily enable it by going to the View menu and checking the checkbox beside Formula Bar. See the following screenshot:

Figure 4.56 – Enabling the formula bar in Power Query

Figure 4.56 – Enabling the formula bar in Power Query

Most of the commonly used transformations can be easily accessed upon right-clicking on the column name. See the following screenshot:

Figure 4.57 – Right-clicking on a column to reveal common transformations

Figure 4.57 – Right-clicking on a column to reveal common transformations

Always set the column data type. It might not cause you much trouble in Excel, but as you begin to apply your Power Query knowledge in Power BI and other platforms, you will face issues that are linked to improperly set column data types. A quick way to set the data types for all columns at once is to use Detect Data Type under the Transform menu after selecting all the columns. See the following screenshot:

...

Understanding Close & Load To

When you are done with your Power Query data ingestion and transformation, you will have to load the transformed data for access within Excel’s main application area. You can access the load feature under the Home menu. You will be presented with Close & Load and Close & Load To.... See the following screenshot of the Close & Load options:

Figure 4.62 – Close & Load in Power Query

Figure 4.62 – Close & Load in Power Query

You might wonder what the difference is between Close & Load, and Close & Load To.

Close & Load loads the transformed data using your default settings. If you have not altered the default settings since Excel’s installation, it will load each table into a separate Excel sheet and also into the data model. The data model is essentially Power Pivot, which we will discuss in Chapter 5, PivotTable and Power Pivot.

Close & Load To presents you with all the options for where you can load the...

Demystifying the underlying M code

The language in which the formulas and transformations you do in Power Query are written is called M. To master Power Query, you have to be familiar with the general syntax of the M language. At the core of all things done in Power Query, there are five value types:

  • Primitive values: These are single entries such as numbers, text, logic, and null. Examples are 2012, "Michael Olafusi", false, and null.
  • List values: We touched on these briefly in the introduction. They are an ordered collection of entries or values within curly brackets. An example is {23, 45, 78, 95}, which is a list of primitive values. However, a list can be a collection of a list, a record, a primitive value, or a combination of different types of values. Hence, {34, "Olafusi", {23, null, 10}, 25} is a valid list.
  • Record values: These are a collection of key-value pairs within square brackets. An example is [John = 18, Michael = 24, Mary = 29...

Summary

This has been a very long chapter as we went through special uses of Power Query – how it allows you to connect directly to over 100 data sources and carry out data transformations. We went through some common transformations such as appending data, merging data, unpivoting columns, filling series, and replacing values. I also shared with you some important tips to keep in mind as you work toward boosting your competence in the use of Power Query. Lastly, we examined how to load your transformed data and get a hang of the M code that powers everything in Power Query.

In the next chapter, we will explore the use of PivotTables and Power Pivot to create the analysis and dashboards you desire after using Power Query to pull in the clean data required.

lock icon
The rest of the chapter is locked
You have been reading a chapter from
Building Interactive Dashboards in Microsoft 365 Excel
Published in: Feb 2024Publisher: PacktISBN-13: 9781803237299
Register for a free Packt account to unlock a world of extra content!
A free Packt account unlocks extra newsletters, articles, discounted offers, and much more. Start advancing your knowledge today.
undefined
Unlock this book and the full library FREE for 7 days
Get unlimited access to 7000+ expert-authored eBooks and videos courses covering every tech area you can think of
Renews at $15.99/month. Cancel anytime

Author (1)

author image
Michael Olafusi

Michael Olafusi is a 9x Microsoft Most Valuable Professional (MVP) and a business intelligence consultant. He is the lead consultant and founder of MHS Analytics Inc. in Canada and UrBizEdge Limited. He has been consulting for clients across North America, Europe, and Africa on data analysis, business intelligence, and financial modeling for the past 10 years. Outside of his consulting business, he is a member of Rotary and the Southern Cruisers Riding Club (SCRC) Chapter 373. He is a proud member of the Canadian Red Cross friendly calls volunteer team. He is also a faculty member at WorldQuant University, USA.
Read more about Michael Olafusi