


Shapes
Shapes can be found under the Insert menu in Excel. They are another interesting way to visually present insights in Excel. Shapes have been in Excel for decades and are currently broadly categorized as lines, rectangles, basic shapes, block arrows, equation shapes, flowcharts, stars and banners, and callouts. The following screenshot shows the categories:
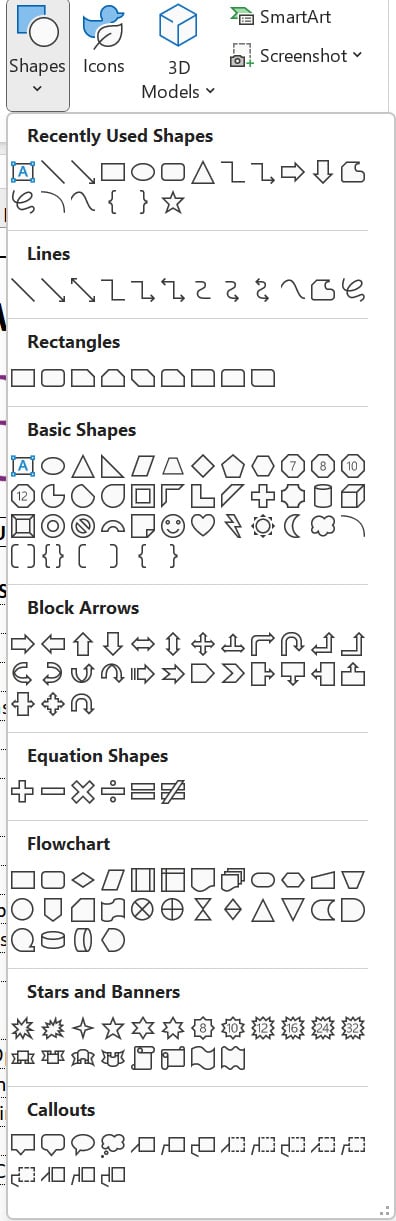
Figure 9.24 – Shape categories in Excel
There are two general ways of using shapes for visualization in Excel. The first is to have the shape linked to a cell, and the second is to use the shape to organize other objects to achieve a visually engaging outlook.
We will demonstrate how to link a shape to a cell so that the shape reflects the value in that cell. We start by inserting a rectangle, changing the default fill color and outline to a more visually pleasing one, and positioning it where we want. Then we click on the shape, click inside the formula bar, hit = on the keyboard, and...