


In the following sections, we present a series of PRD reports typically included as examples of Pentaho solutions and in the sample reports of PRD.
The buyer report is found at the following location in the top menu:
Help | Sample Reports | Operational Reports | Buyer Report
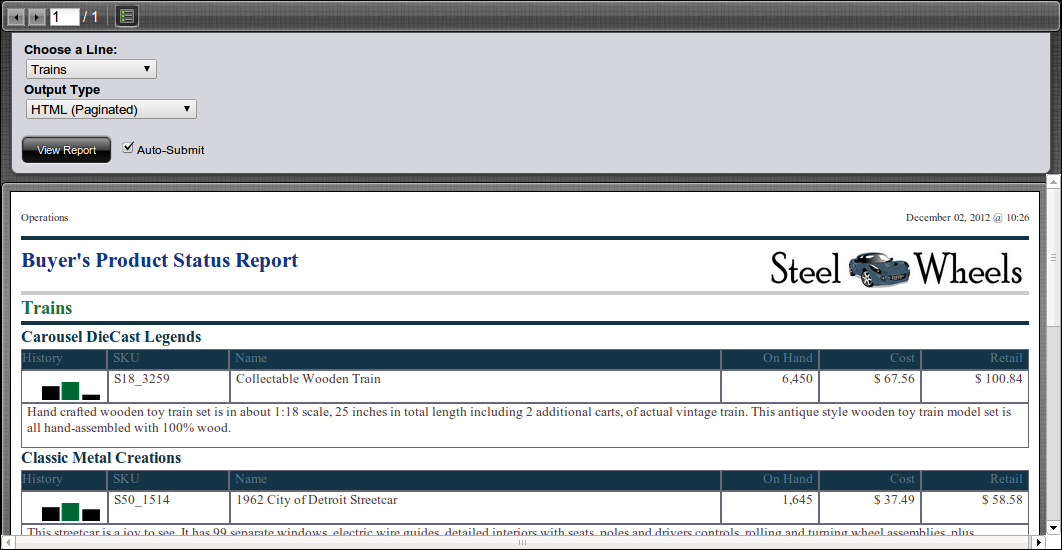
This report presents an analysis of the products belonging to each product line grouped by the vendor. For each product, it shows a sparkline with information about the sales of this product in the last three years. This report allows the end user to select the product line to be displayed.
As can be seen in the top part of the report, there are two selectors for passing parameters to the report:
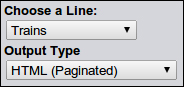
The selectors will then show a report of the product line (Choose a Line:) indicated in the parameter, in this case Trains, and its visualization format will be the one chosen in Output Type, in this case HTML (Paginated).
To show information about each product, this report uses sparklines, text, numbers, and monetary values (in dollars):

Also, an image has been placed in the report title (see the first screenshot of this section).
The income statement report is found at the following location in the top menu:
Help | Sample Reports | Financial Reports | Income Statement
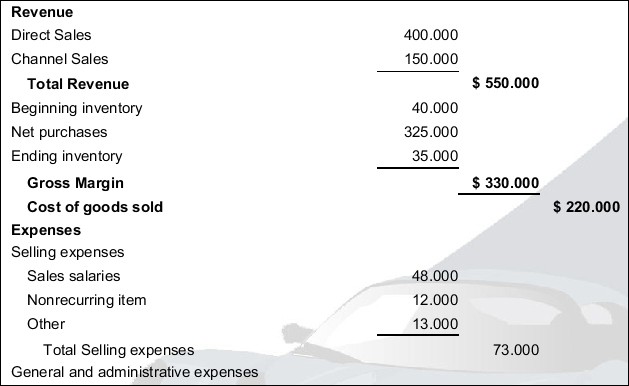
This report shows the current income statement of the company and shows calculations of totals and subtotals, grouping each item in its respective category (Revenue, Cost of Goods, and so on).The default for the Output Type parameter value has been set to PDF, so when it is executed, it will download the file Income Statement.pdf. If you prefer to view the report in another format, you only have to change the value of the Output Type parameter.
This report has an image as a background.
The inventory list report is found at the following location in the top menu:
Help | Sample Reports | Operational Reports | Inventory List
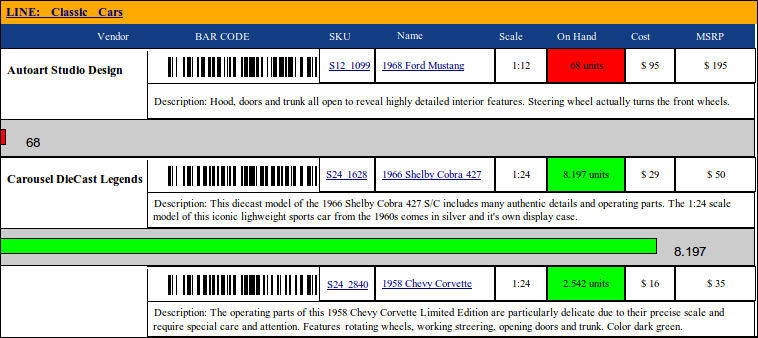
This report shows information about the stock of products and allows the end user to select one or more product lines that need to be shown.
This report uses bar codes:
It uses hyperlinks (drill through) to other reports:

If you click on the values in the field SKU, a new tab will open displaying a report with additional information about this SKU. In this case, if we click on S12_1099, a report shown in the following screenshot will appear:
It also uses links of web pages:
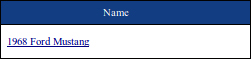
If you click on the values in the field Name, a new web browser tab opens with a web page that searches for Google Images.
This report uses conditional formatting, that is, the background color of the field On Hand is determined according to certain values and conditions. This allows for the viewing of the statuses of the reports through indicators in a very simple way, that is, the indicator is green when the values are good, yellow when they are acceptable, and red when they are bad.

The invoice report is found at the following location in the top menu:
Help | Sample Reports | Production Reports | Invoice
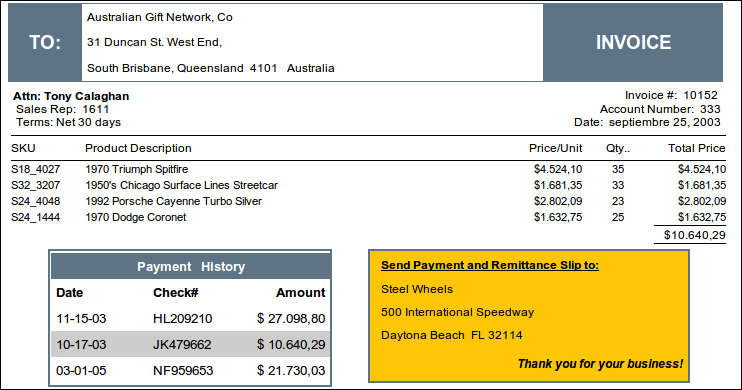
This report shows all the invoices that have been issued to customers. Each invoice is presented on a separate page, and the end user has the ability to select the client they want to analyze.
The product sales report is found at the following location in the top menu:
Help | Sample Reports | Oper ational Reports | Product Sales
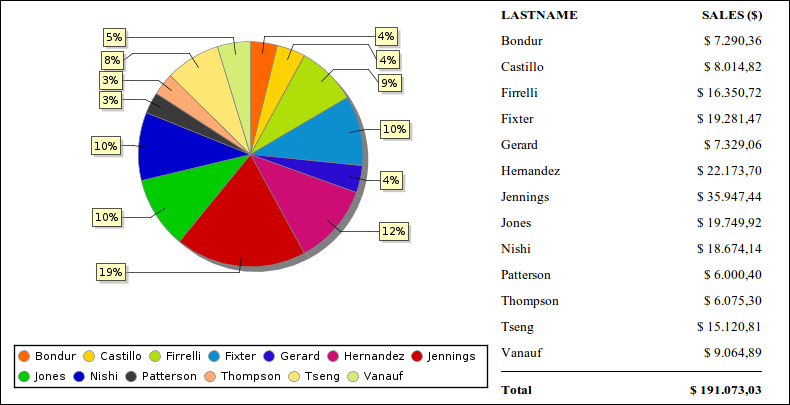
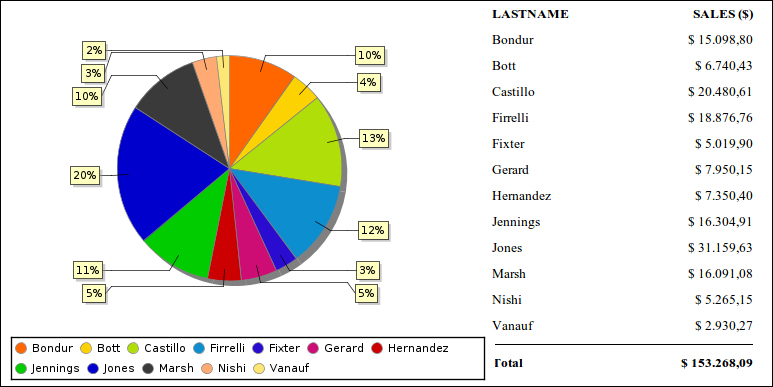
This report shows information about sales made to the customers. On the left-hand side, a pie chart shows the percentage of sales made to each customer and on the right-hand side, a sub-report shows a list of the amount of sales in detail.
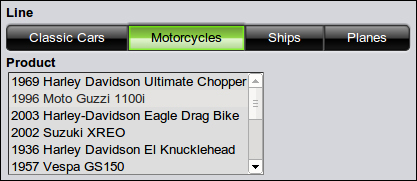
It is important to point out that the parameter selectors are related, that is, once a value is chosen for Line, only products belonging to that line will be shown in the options of the selector Product:
This report is found at the following location in the top menu:
Help | Sample Reports | Operational Reports | Top N Customers
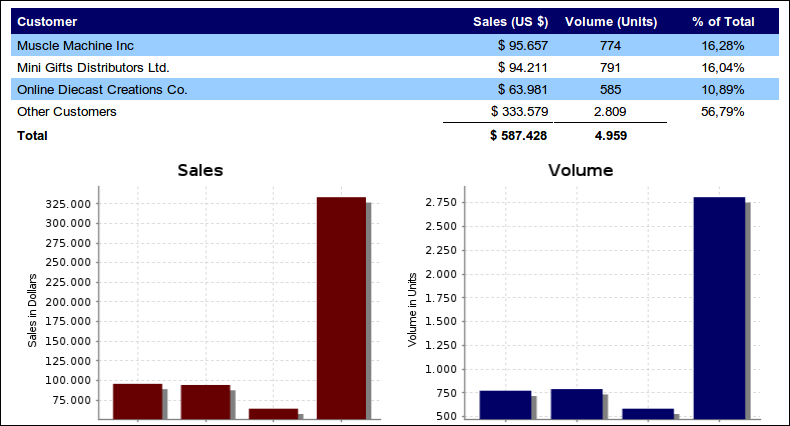
This report shows an analysis of the top N customers; here N can be defined via a parameter. It also displays information amount and percentage of the total sales, and uses a table and two bar charts.
This report is found at the following location in the top menu:
Help | Sample R eports | Advanced | HTML Actions
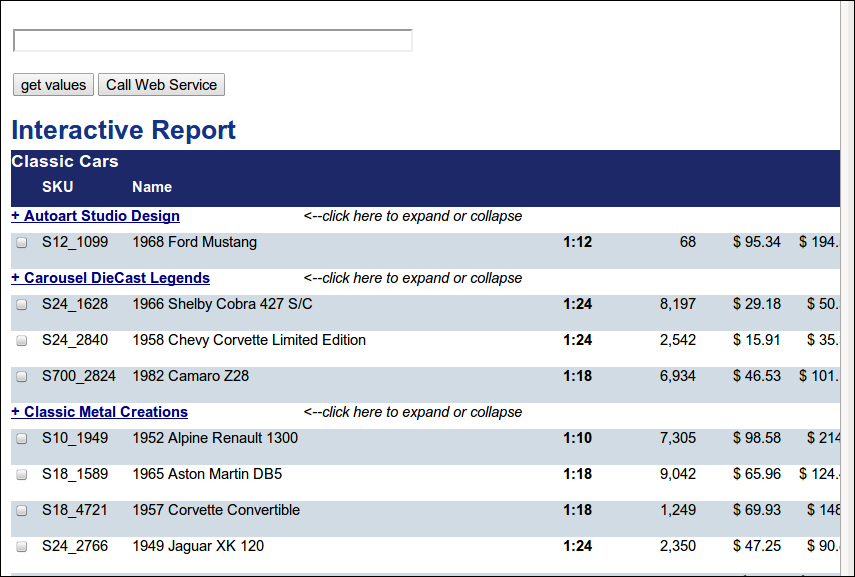
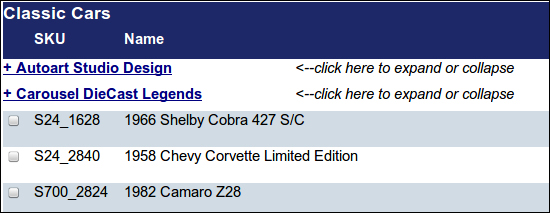
This report shows a list of products grouped by the vendor and provides information about their code, name, purchase price, and so on. Furthermore, it lets us expand or collapse the different groups. That is, if you click on + Autoart Studio Design, all the child nodes collapse.
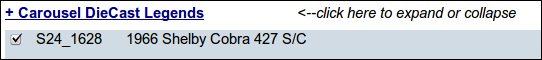
This report lets us search for the models of the cars we choose in Google Images. For example, choose 1966 Shelby Cobra 427 S/C as shown in the following screenshot:
Click on the get values button. You will see that all the auto models will be shown in the following screenshot:
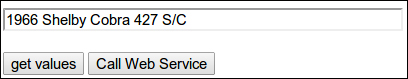
Click on the Call Web Service button; a new web browser window will open with a web page that searches for Google Web.