Reader small image

You're reading from  Pentaho 5.0 Reporting by Example: Beginner's Guide

Product typeBook
Published inAug 2013
PublisherPackt
ISBN-139781782162247
Edition1st Edition
Tools
Right arrow
Author (1)
Right arrow

Chapter 3. Start PRD and the User Interface (UI) Layout

In the last chapter, we installed and configured Pentaho Report Designer (PRD). Now it's time to execute PRD and begin to familiarize ourselves with the user interface (UI).

In this chapter we will see:

  • How to start PRD in different operating systems

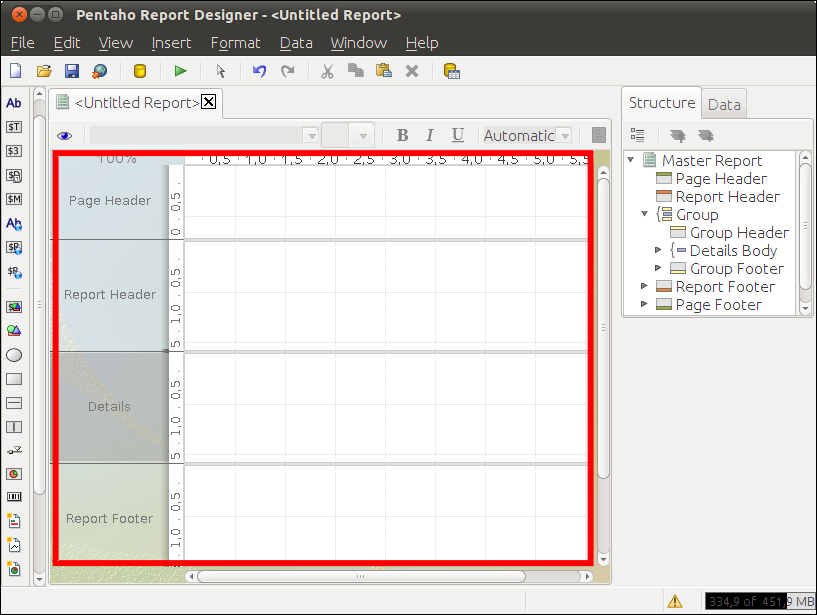
  • An explanation of the layout of the PRD UI

  • The use and the goal of each area within the UI of PRD, for example, the Work area, the Insertable objects, the Report tree structure, Style and Attributes, the Data panel, the Menu bar, and so on

We will present each part of the PRD layout through screenshots and provide details about the most important buttons and options. We hope that by the end of the chapter, you will have a fairly clear idea of the structure of the PRD UI and its different functions so that in the following chapter, when we make our first report, it will not be difficult to follow the steps described.

Starting PRD


We will start PRD and create a new report, and finally we will explain each of the areas of the PRD UI layout.

Time for action – starting PRD and creating a new report


In the following steps, we will start PRD and create a new report:

  1. For starting PRD, we will follow the instructions according to our operating system:

    • In Linux environments: Open a terminal and type the following commands:

      shell> cd [PRD_HOME]
      shell> sh report-designer.sh

      Note

      Remember that where it says [PRD_HOME], you should type the complete path to the PRD folder.

    • In Windows environments: Go to the folder [PRD_HOME] and execute (press Enter or double-click on) the file reportdesigner.bat

      After doing this, as PRD loads its configuration and starts up, it will show us the following screenshot:

      Once PRD has been executed, we will see the following:

      Note

      Before continuing, we should make clear that PRD version 4 is still in development as this book is being written. The reader may find some minimal differences in the UI.

  2. Now we will create a new report. This can be done in several ways:

    1. Choose the option New Report in the Welcome window...

PRD layout


Now we will analyze the PRD layout bit by bit.

We can identify the following sections in the layout:

  1. Work area

  2. Insertable objects

  3. Report tree structure

  4. Style and Attributes

  5. Data panel

  6. Menu bar

  7. Shortcuts

  8. Tab section

  9. Format tools

  10. Message section and memory indicator

We will see the most important options in each section, and we will specify the area of the PRD layout where each of these sections are located.

The Work area

This is found at the center of the screen. This area is more commonly called Canvas, and this is where we will place the fields, charts, lines, and so on that we want to see in the report.

To the left of the Work area, we will find the following sections:

  • Page Header

  • Report Header

  • Details

  • Report Footer

  • Page Footer

By default, only these sections are visible in the Work area of the new reports. There are other predetermined sections that are initially invisible, such as Group Footer and Group Header. New sections can also be added as subgroups.

Insertable objects

These are found...

Summary


After finishing this chapter, we have the foundation needed to continue with the exercises in the following chapters. We have covered the following topics:

  • We have started PRD in different operating systems, and we have differentiated among a series of sections in the PRD UI. This division in sections correspond to the physical location of each part but principally to the function that each performs in the UI.

  • We defined the Work area as the place where we add fields, graphics, and so on that we want to include in the report.

  • We described the function of each object that we can add to our reports, which are found in Insertable objects.

  • In the Report tree structure, we saw how the objects in our report are structured.

  • We explained in Style and Attributes that we can configure the details of each object selected.

  • We also explained that in the Data panel we can create and edit data sets, functions, environments, and parameters.

These are the most important sections in the PRD layout, as they...

lock icon
The rest of the chapter is locked
You have been reading a chapter from
Pentaho 5.0 Reporting by Example: Beginner's Guide
Published in: Aug 2013Publisher: PacktISBN-13: 9781782162247
Register for a free Packt account to unlock a world of extra content!
A free Packt account unlocks extra newsletters, articles, discounted offers, and much more. Start advancing your knowledge today.
undefined
Unlock this book and the full library FREE for 7 days
Get unlimited access to 7000+ expert-authored eBooks and videos courses covering every tech area you can think of
Renews at $15.99/month. Cancel anytime