

Examining Tableau's basic structure
The Tableau platform has a multitude of products and features to choose from to help you and your organization best utilize data to make informed decisions. These products can be integrated for an optimal experience and are flexible enough to adapt to your organization's needs. Because each product can be customized and utilized in so many ways, no two Tableau Server environments are exactly the same. Every organization has its own practices regarding data collection, storage, management, and access. Likewise, every organization will deploy the use of Tableau products and services to fit their data needs and culture. No matter the differences, there are some basic processes that apply to all who use Tableau Desktop and Tableau Server. This process is illustrated in Figure 1.1:
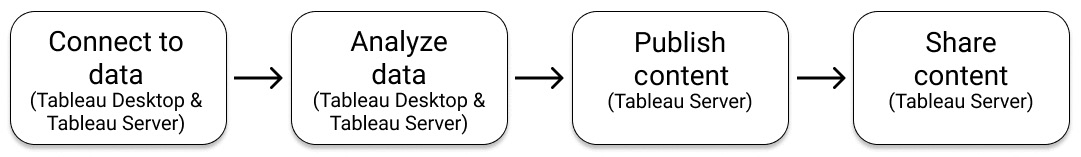
Figure 1.1 – The process of developing and sharing analytic insights with Tableau
In this section, we will examine each of these steps and the application of their corresponding Tableau products. Let's begin by gaining an understanding of data sources.
Data sources
Before any analysis takes place, first, you must connect to your data. You can do this from Tableau Desktop by connecting directly to your database or by connecting to a published data source on Tableau Server. The various types of Tableau data connections include the following:
- Data extracts: These refer to a subset, or snapshot, of data that is stored in Tableau file format, that is,
.hyperor.tde. (Note that you will only encounter a.tdefile format if you use a version of Tableau Desktop prior to 10.5.) These files are optimized for performance within Tableau. Extracts can be embedded in a workbook when publishing to Tableau Server and can be scheduled to refresh on a regular basis so that the data stays up to date. - Live connections: These allow you to query the database to update with real-time data. Every action performed in Tableau Desktop or Web Edit from Tableau Server initiates a query to the database.
Tip
While "real-time" data might sound ideal, in reality, your data source is rarely optimized to provide real-time performance. In fact, if the underlying data tables that you are connected to only update once a day, then real-time queries with a live connection from Tableau will not provide any new data until that initial data table has been updated. In this case, it would be best to use an extract. Likewise, if you have a slow live connection, you will benefit from creating an extract.
- Published data sources: These refer to a data source that has already been established using either a live connection or a data extract and then published to Tableau Server. Once on the server, a single published data source can be used by multiple workbooks to provide consistency, reliability, and efficiency.
You might find that the raw data available to you is not formatted in an optimal way nor is it clean enough to perform an accurate analysis. For example, there might be inconsistencies with the spelling or number formatting. When this occurs, your data should be cleaned before you begin your analysis using tools such as Tableau Prep or Alteryx. Once you have cleaned and prepared the data, you can establish a data connection in Tableau Desktop using one of the methods described earlier.
Tableau Desktop
Once you have established your data connection, you are ready to begin analyzing the data. This is where Tableau Desktop comes in. Tableau Desktop is a tool that allows users to explore and visualize their data for analysis, operational reporting, and more. Figure 1.2 shows the Tableau Desktop interface when it is connected to the included Sample – Superstore dataset that comes with Tableau:
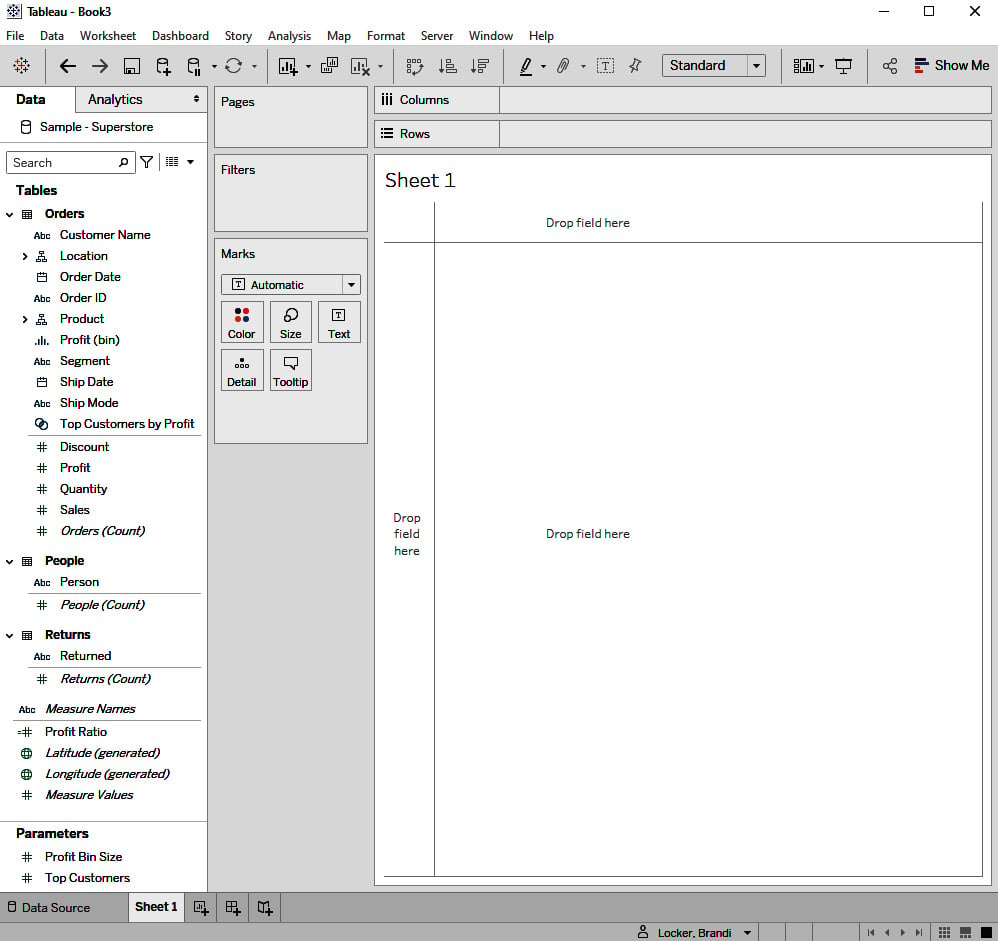
Figure 1.2 – Tableau Desktop
Using this interface, analysts using Tableau can create reports and data visualizations, known as dashboards, to share with others. An example of a dashboard is shown in Figure 1.3:
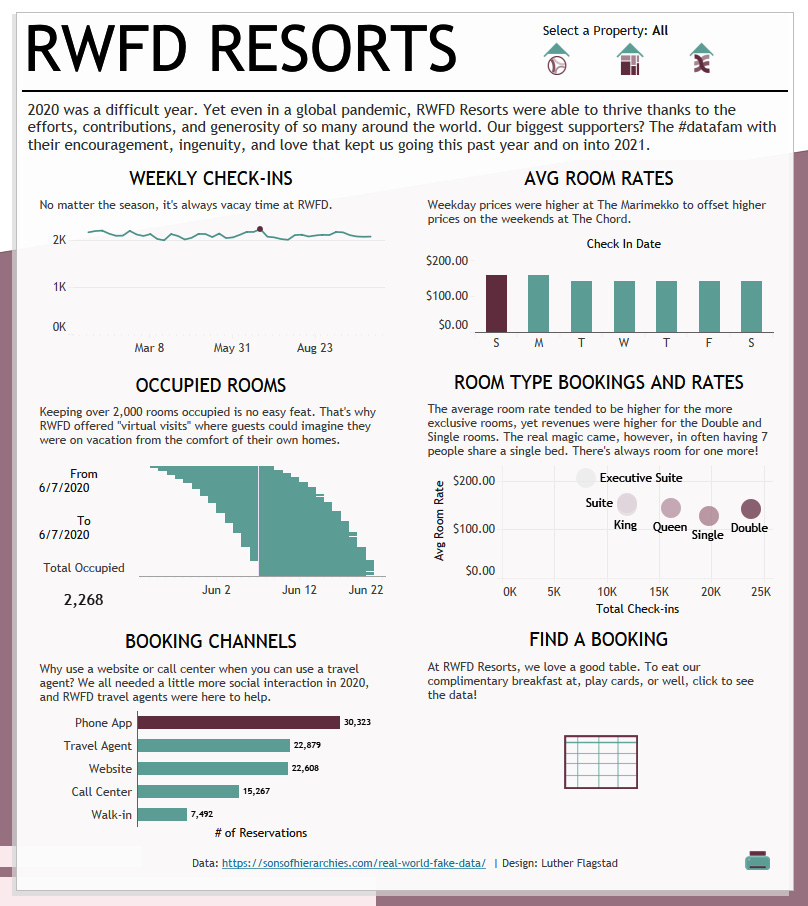
Figure 1.3 – A dashboard created by Luther Flagstad
Throughout this book, there are examples of dashboards created by individuals within the Tableau community. These examples highlight some of the community initiatives and resources that are available to anyone wishing to develop their data analysis and visualization skills further. You can learn more about the Tableau community by visiting https://www.tableau.com/community. We will also discuss these resources in more detail in Chapter 10, Conclusion.
Tip
To find inspiration and discover what Tableau can do, you can visit https://public.tableau.com and browse the gallery to see the Viz of the Day. Additionally, you can use the search feature to search for "superstore." This will allow you to browse Tableau Public to view some of the amazing data visualizations created by individuals within the Tableau community using the Sample – Superstore dataset.
There are a few terms used within this book that are commonly used on the Tableau platform that you need to be familiar with. Some of these are as follows:
- Worksheet: This refers to a single page within Tableau Desktop where a visualization (such as a chart, graph, or table) is created.
- Dashboard: This refers to a collection of worksheets containing charts, graphs, or tables that are arranged in a single view.
- Story: This refers to a sequence of worksheets or dashboards that are arranged to explain an analysis or to tell an informative story.
- Workbook: This is a Tableau file containing worksheets, dashboards, and stories. Files can be saved as a
.twbor.twbx:.twb: This is the default Tableau Desktop file type. The data source will not be embedded (available to other users who are sent a copy of the file)..twbx: This is a packaged workbook that has the data embedded within the file. This file type can easily be shared with others since they will be able to view and interact with the included data.
- View: This is normally used in a more general context as something that is viewed on the screen, such as a worksheet, dashboard, story, or metric.
Once your analysis is complete, these data creations can be shared with others within your organization using Tableau Server.
Tableau Server
As outlined in the previous section, Tableau Server provides a place to store and share data visualizations created in Tableau Desktop. It can be used as a communication tool to provide users with up-to-date information and alerts. There is also a feature known as Web Edit that allows you to make changes to the content on the server from your web browser. Your capabilities within the Web Edit feature will depend on your permissions.
You might encounter similar Tableau products that allow you to share data visualizations, such as Tableau Online and Tableau Public. Here is a quick overview of the Tableau products that enable you to publish and share your content:
- Tableau Server: This is a self-governed and self-hosted server that gives an organization full control and responsibility for managing its content and processes.
- Tableau Online: This provides the same functionality as Tableau Server but is fully hosted by Tableau for a hassle-free experience.
- Tableau Public: This is a free, public server that allows individuals within the Tableau community to practice and develop their data visualization skills and share that information with the world. Tableau Public can also be an excellent resource for non-profit organizations.
The purpose of this book is to examine the Tableau Server experience, but most of the principles learned here will also apply to Tableau Online. Tableau Public is a unique service that is simpler, free to use, and available to anyone. We will discuss how to connect and publish content to Tableau Server and Tableau Public in the next chapter, Chapter 2, How to Connect and Publish to Tableau Server.
Once content has been published to Tableau Server, it is ready to be shared with the end users.
End users
The end users are those users who use the data to make business decisions. This can include analysts, front-line management, business executives, and everyone in between. They require access to the insights provided by the data products. When a dashboard is created and published to Tableau Server, it is the end user who views the dashboard and determines what to do with the information and how it can impact the organization.
As an analyst, developer, or business partner, you can share content on Tableau Server with other users by sharing a URL or using the Share feature discussed in Chapter 8, Interacting with Views on Tableau Server. Throughout this book, you will learn how to best utilize Tableau Server in a way that optimizes your own efficiency and maximizes the value of your organization's server content for the business. End users can access the data through a web browser using their computer, tablet, or smartphone. Tableau Server is flexible enough to facilitate these needs and can be optimized for a variety of viewing methods.
So, you now have a basic understanding of the structure of the Tableau platform and how various content creators, and users interact with each component. The varying needs of these users will impact the way the server is used and managed. Understanding how other users interact with the server will help you to find ways to improve the end user experience and drive engagement with the content available on the server.
In the next section, we will review licenses, site roles, and permissions along with the impact they each have on the user experience.