Reader small image

You're reading from  Getting Started with Tableau 2018.x

Product typeBook
Published inSep 2018
PublisherPackt
ISBN-139781788838689
Edition1st Edition
Tools
Right arrow
Author (1)
Tristan Guillevin
Tristan Guillevin
author image
Tristan Guillevin

Tristan Guillevin is a Business Analyst at Ogury. In 2017, he won the Iron Viz - the ultimate data visualization battle, organized by Tableau every year in Las Vegas. His passion for data visualization and for Tableau has taken him around the world. He enjoys helping people with Tableau by making webinars, conferences, and writing blog articles.
Read more about Tristan Guillevin

Right arrow

Device layout


On Tableau Desktop, you can create device layouts for your Dashboard. Then, depending on the device used to open the Workbook on Tableau Server, the right layout is automatically chosen. 

Note

Device Layouts also works when publishing a Dashboard on Tableau Public.

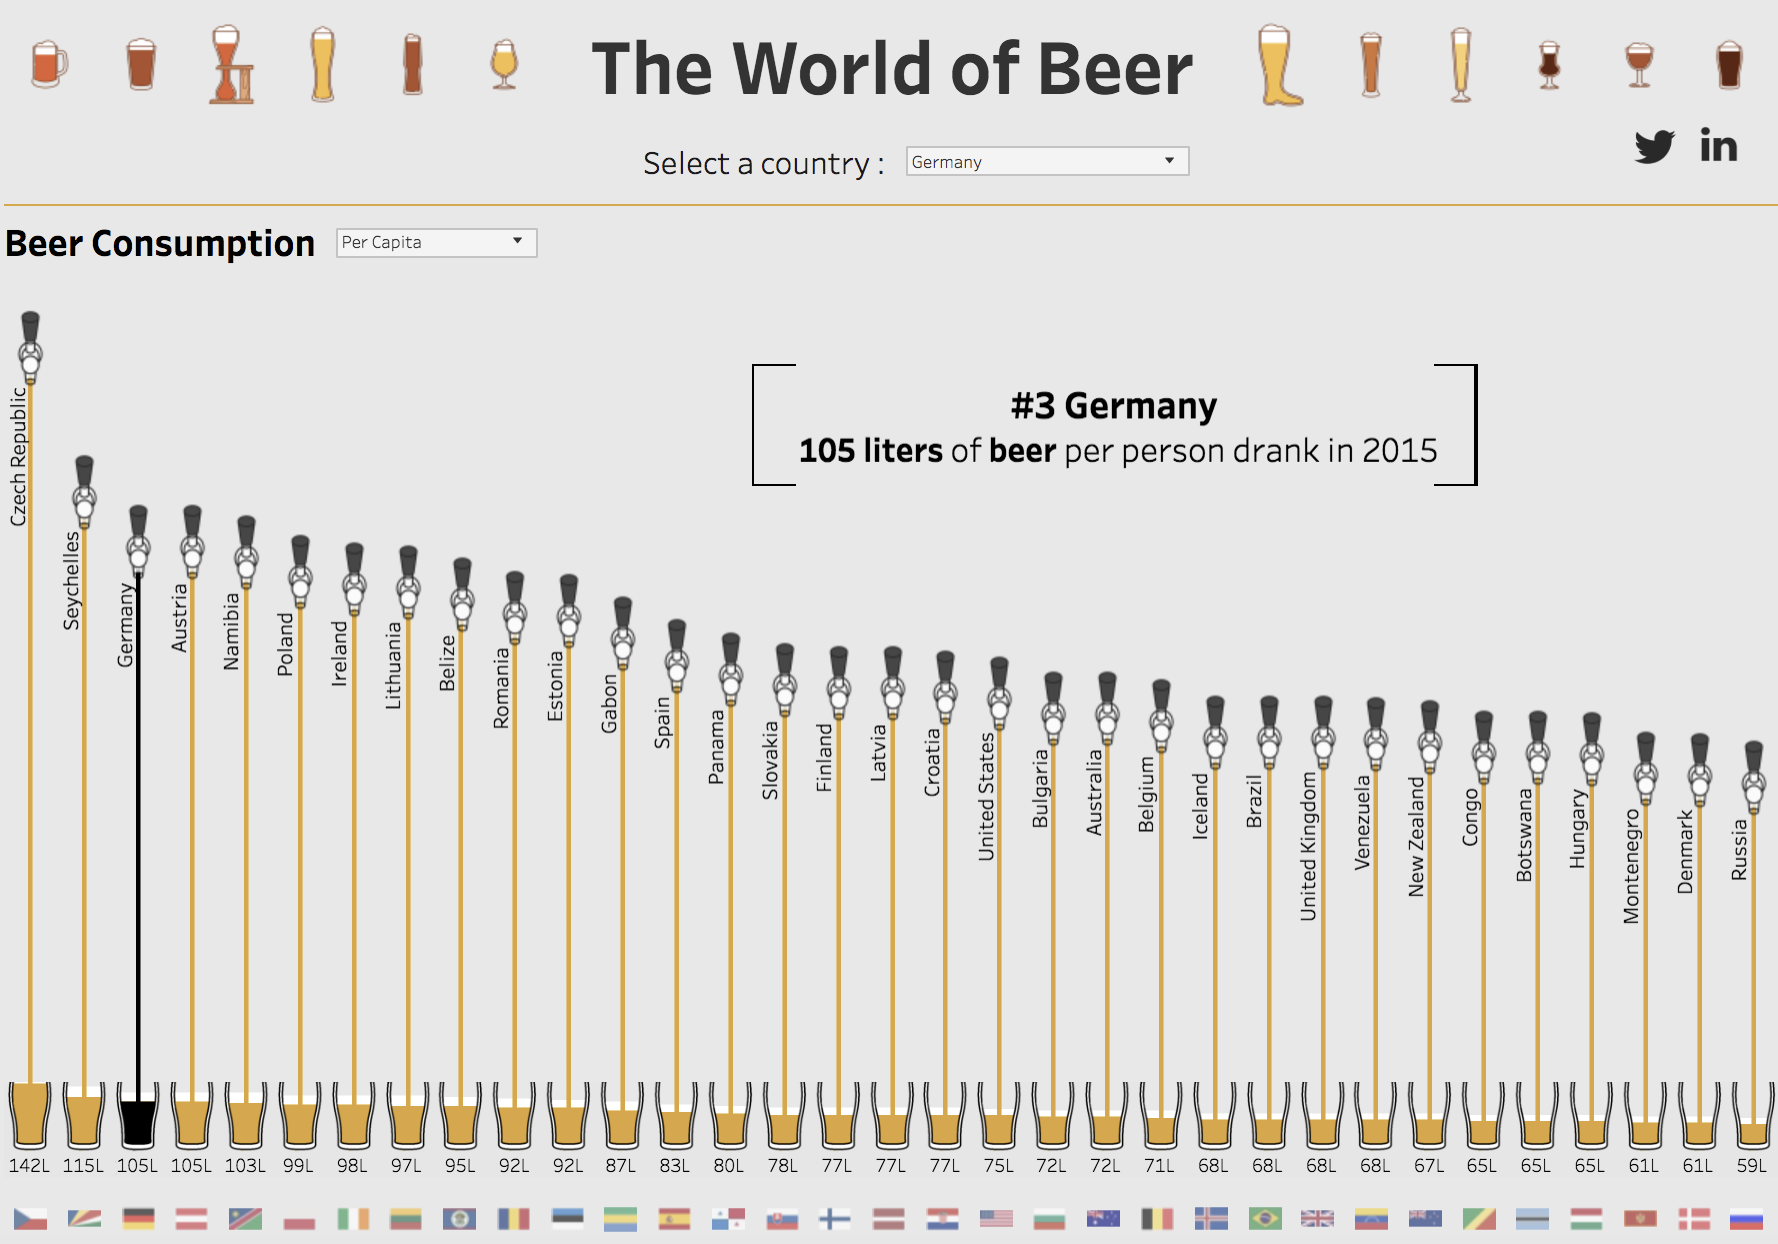
For example, here's a Dashboard displayed on a computer:

Here is the same Dashboard if you open it on a mobile:

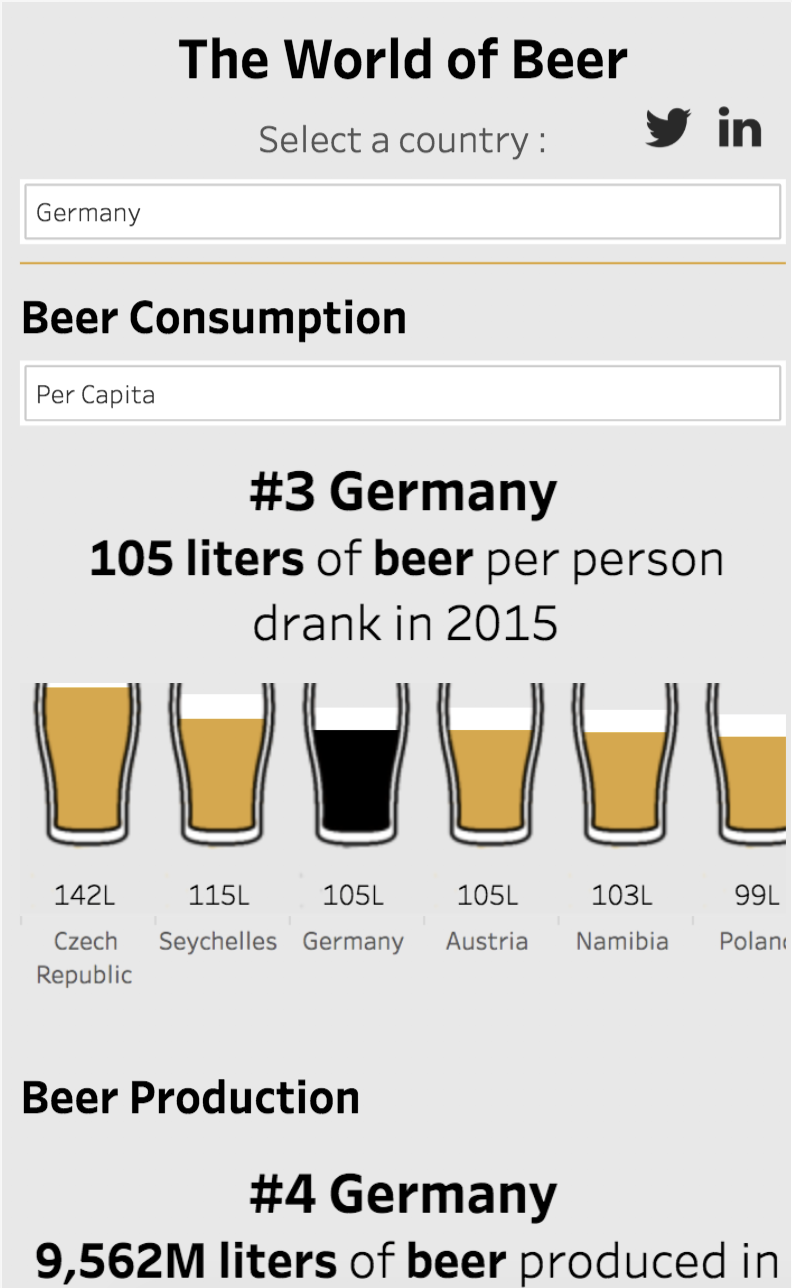
As you can see, the ideas and insights are visible in both layouts, but are adapted for each device.  

Note

Are you interested in beer consumption or do you want to learn how to build this visualization? All my Tableau Public Workbooks are downloadable: https://public.tableau.com/profile/guillevin#!/.

The section is divided into two parts. First, we'll see how to create a Device layout, then how to preview the results on Tableau Desktop.

Creating a Device layout

To create a Device layout, first click on the Device Preview button on a Dashboard to open the Device layout toolbar:

On this toolbar, you need to do the...

lock icon
The rest of the page is locked
Previous PageNext Page
You have been reading a chapter from
Getting Started with Tableau 2018.x
Published in: Sep 2018Publisher: PacktISBN-13: 9781788838689

Author (1)

author image
Tristan Guillevin

Tristan Guillevin is a Business Analyst at Ogury. In 2017, he won the Iron Viz - the ultimate data visualization battle, organized by Tableau every year in Las Vegas. His passion for data visualization and for Tableau has taken him around the world. He enjoys helping people with Tableau by making webinars, conferences, and writing blog articles.
Read more about Tristan Guillevin