Reader small image

You're reading from  Getting Started with Tableau 2018.x

Product typeBook
Published inSep 2018
PublisherPackt
ISBN-139781788838689
Edition1st Edition
Tools
Right arrow
Author (1)
Tristan Guillevin
Tristan Guillevin
author image
Tristan Guillevin

Tristan Guillevin is a Business Analyst at Ogury. In 2017, he won the Iron Viz - the ultimate data visualization battle, organized by Tableau every year in Las Vegas. His passion for data visualization and for Tableau has taken him around the world. He enjoys helping people with Tableau by making webinars, conferences, and writing blog articles.
Read more about Tristan Guillevin

Right arrow

Chapter 12. Advanced Data Connections

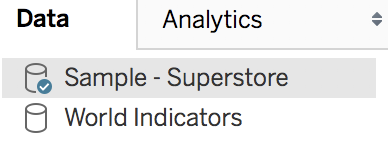
In a Workbook, you can add as many data sources as you want. In a Worksheet, you can see which Data Source is used thanks to the tick mark (✓) next to its icon, as you can see in the following screenshot:

You can create different Worksheets based on different data sources and assemble them in a Dashboard. But what if you need more than that? What if you want to create a visualization using two different data sources or create a unique data source based on a different type of connection? You can do all of that, too.

In this chapter about advanced data connections, we'll see how to work with multiple datasets as well as some other new features for unions. The three sections of this chapter focus on the following:

  • Cross-database Join
  • Data-blending
  • Wildcard union

The different examples require a specific dataset or file to be reproduced.

Let's start this chapter with a way of combining multiple datasets in one Data Source. 

Cross-database Join


In Chapter 1Catching Up with Tableau 2018, about data connection, you saw how to create joins between different Tables of the same dataset. With cross-database Joins, you can create joins between different tables from different connections of different types. It's a great way to add new dimensions to your analysis.

Note

You can't use all the different types of connections in a cross-database Join. A published Data Source, for example, can't be joined.

As an example, let's create a join between Sample-Superstore and another Excel File, Reimbursement, containing the reimbursed orders.

Note

To reproduce the following example, you need to download the Reimbursement Excel file available on the website, book.ladataviz.com, in theChapter 12section, or use this link: https://ladataviz.com/wp-content/uploads/2018/09/Reimbursement.xlsx.

Here's what the Reimbursement table contains:

Here's how to create a cross-database Join between those two files:

  1. Open Tableau, and click on the saved...

Data-blending


Data-blending is a way of using different fields from different Data Sources in one Worksheet. There is always a primary data source (the tick icon in blue) and one or multiple secondary data sources (the tick mark in orange). As for joins, one or multiple common fields are needed to create the relationships between the data sources. 

Unlike joins, data-blending is often used to add new Measures. Fields coming from the secondary data sources are always aggregated. However, they are only aggregated using the common fields, so there is no data duplication. Finally, data-blending can rapidly have a negative impact on performance.

Note

The more different values there are in the common Fields, the bigger the impact on performance. 

Fields with the same name can automatically be used to create the relationship. In the secondary data sources, you can recognize the fields that can be used for the relationship with the small link icon next to their name. You can click on the link icon to...

Wildcard Union


The first time you saw how to create Unions, you had to select the different tables of the same dataset. Wildcard Unions allow you to create more powerful Unions that automatically add all the files and all the tables that match a specific pattern. This kind of Union is convenient as you don't have to add the new Tables manually, you only need to refresh the Data Source. 

As an example for Wildcard Union, I split the Sample-Superstore Excel file into four files, one for each year, and I put it in a folder named Sales as displayed here: 

Note

To reproduce the following example, you need to download the Sales zip file available on the website, book.ladataviz.com, in the Chapter 12 section or use this link: https://ladataviz.com/wp-content/uploads/2018/09/Sales.zip.

Let's Union those files:

  1. Open Tableau Desktop and chose Microsoft Excel from the list of connectors.
  2. Select the Sales 2015.xlsx file.
  3. Replace Sheet1 with New Union:
  1. Select the second tab, Wildcard, and configure it to include...

Summary


This chapter was short but the three new features presented will undoubtedly be useful for you! With cross-database Join, you can create a unique Data Source that combines multiple different connections. With data-blending, you can create a relationship between multiple Data Sources to use their fields in the same Worksheet. Finally, you learned how to give superpowers to Unions thanks to Wildcard Unions, a feature that automatically adds files and tables based on a pattern.

We have one last technical chapter to go, and it's not a trivial one, as we'll talk about security. You will see how to secure your data on Tableau Server and in Tableau Desktop, thanks to three different layers of protection. What are you waiting for? You're almost at the end!

lock icon
The rest of the chapter is locked
You have been reading a chapter from
Getting Started with Tableau 2018.x
Published in: Sep 2018Publisher: PacktISBN-13: 9781788838689
Register for a free Packt account to unlock a world of extra content!
A free Packt account unlocks extra newsletters, articles, discounted offers, and much more. Start advancing your knowledge today.
undefined
Unlock this book and the full library FREE for 7 days
Get unlimited access to 7000+ expert-authored eBooks and videos courses covering every tech area you can think of
Renews at $15.99/month. Cancel anytime

Author (1)

author image
Tristan Guillevin

Tristan Guillevin is a Business Analyst at Ogury. In 2017, he won the Iron Viz - the ultimate data visualization battle, organized by Tableau every year in Las Vegas. His passion for data visualization and for Tableau has taken him around the world. He enjoys helping people with Tableau by making webinars, conferences, and writing blog articles.
Read more about Tristan Guillevin