Reader small image

You're reading from  Getting Started with Tableau 2018.x

Product typeBook
Published inSep 2018
PublisherPackt
ISBN-139781788838689
Edition1st Edition
Tools
Right arrow
Author (1)
Tristan Guillevin
Tristan Guillevin
author image
Tristan Guillevin

Tristan Guillevin is a Business Analyst at Ogury. In 2017, he won the Iron Viz - the ultimate data visualization battle, organized by Tableau every year in Las Vegas. His passion for data visualization and for Tableau has taken him around the world. He enjoys helping people with Tableau by making webinars, conferences, and writing blog articles.
Read more about Tristan Guillevin

Right arrow

Creating a year-on-year comparator


To create a year-on-year comparator, you need to combine everything that we saw previously: Calculated FieldReference Line, and Parameter

Your mission (if you accept it) is to build a visualization where you can see the Sales by Sub-Categories of a selected year compared to the previous year with a Reference Line. Color also helps you to quickly spot the sub-categories where the sales are lower than the past year. Here's the final result: 

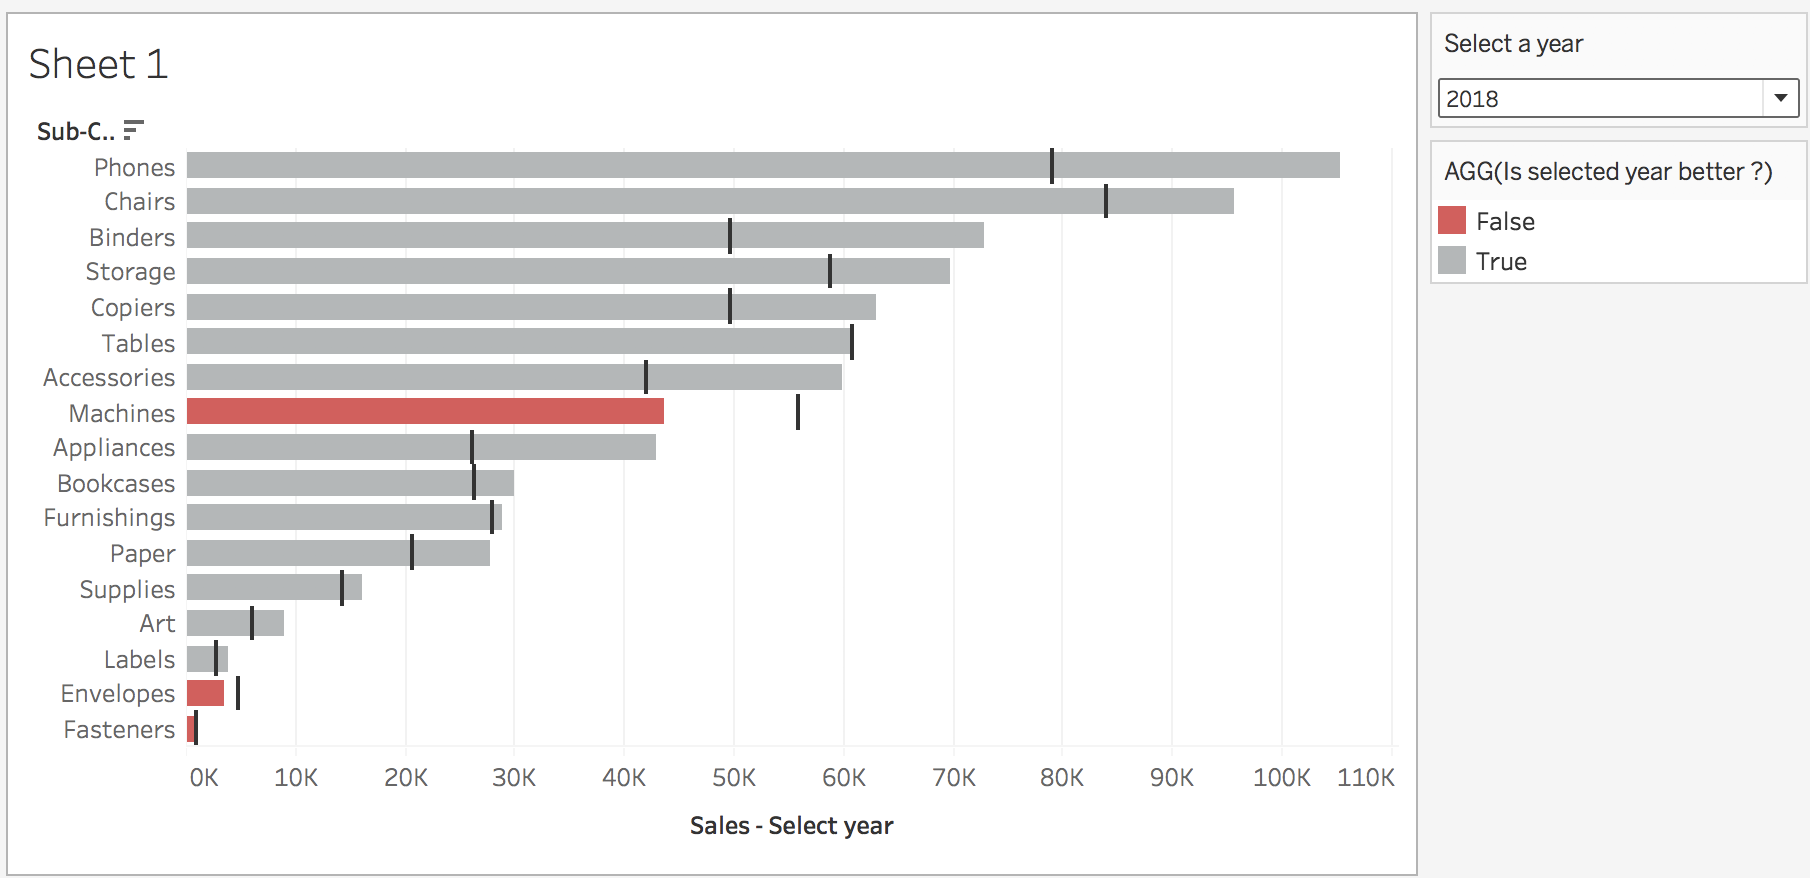
Quite impressive, isn't it? Let's build it! Follow the tutorial:

  1. Create a Parameter to choose the year. Configure it as an Integer with a List of allowable values. The list is composed of four values: 2015, 2016, 2017,  and 2018. You can, if you want to make it perfect, change the display of the values to remove the thousand separators (by modifying the display format or editing the Display As column). Name it Select a year, and choose 2018 as the current value.

Your Parameter configuration window should look like this...

lock icon
The rest of the page is locked
Previous PageNext Page
You have been reading a chapter from
Getting Started with Tableau 2018.x
Published in: Sep 2018Publisher: PacktISBN-13: 9781788838689

Author (1)

author image
Tristan Guillevin

Tristan Guillevin is a Business Analyst at Ogury. In 2017, he won the Iron Viz - the ultimate data visualization battle, organized by Tableau every year in Las Vegas. His passion for data visualization and for Tableau has taken him around the world. He enjoys helping people with Tableau by making webinars, conferences, and writing blog articles.
Read more about Tristan Guillevin