Reader small image

You're reading from  Getting Started with Tableau 2018.x

Product typeBook
Published inSep 2018
PublisherPackt
ISBN-139781788838689
Edition1st Edition
Tools
Right arrow
Author (1)
Tristan Guillevin
Tristan Guillevin
author image
Tristan Guillevin

Tristan Guillevin is a Business Analyst at Ogury. In 2017, he won the Iron Viz - the ultimate data visualization battle, organized by Tableau every year in Las Vegas. His passion for data visualization and for Tableau has taken him around the world. He enjoys helping people with Tableau by making webinars, conferences, and writing blog articles.
Read more about Tristan Guillevin

Right arrow

Filters


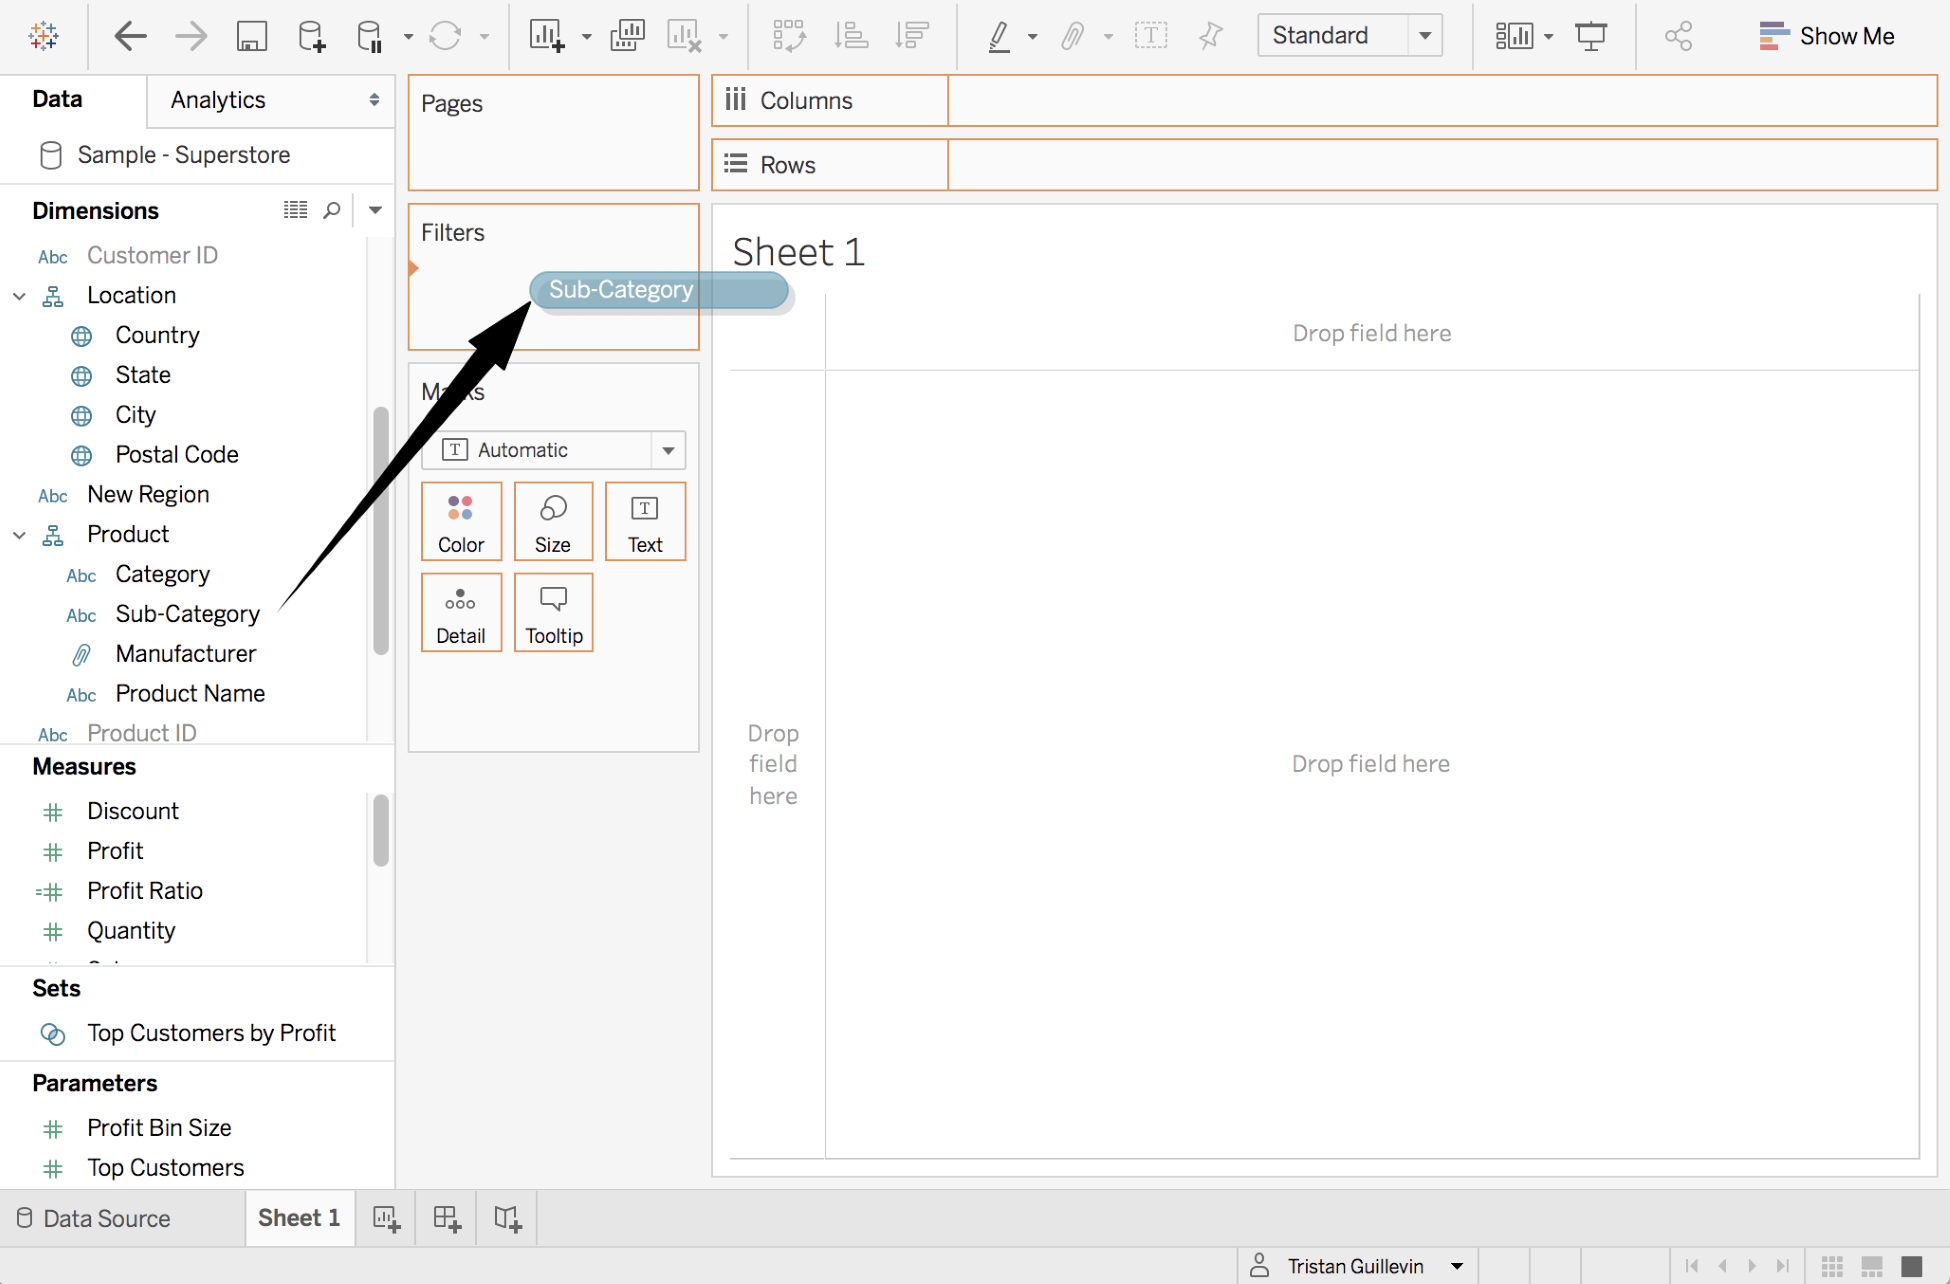
Filters are among the most used features in Tableau. To create a Filter, drag and drop any field onto the Filters shelf. You can filter as many fields as you want. Here's an example of adding a Filter on Sub-Category:

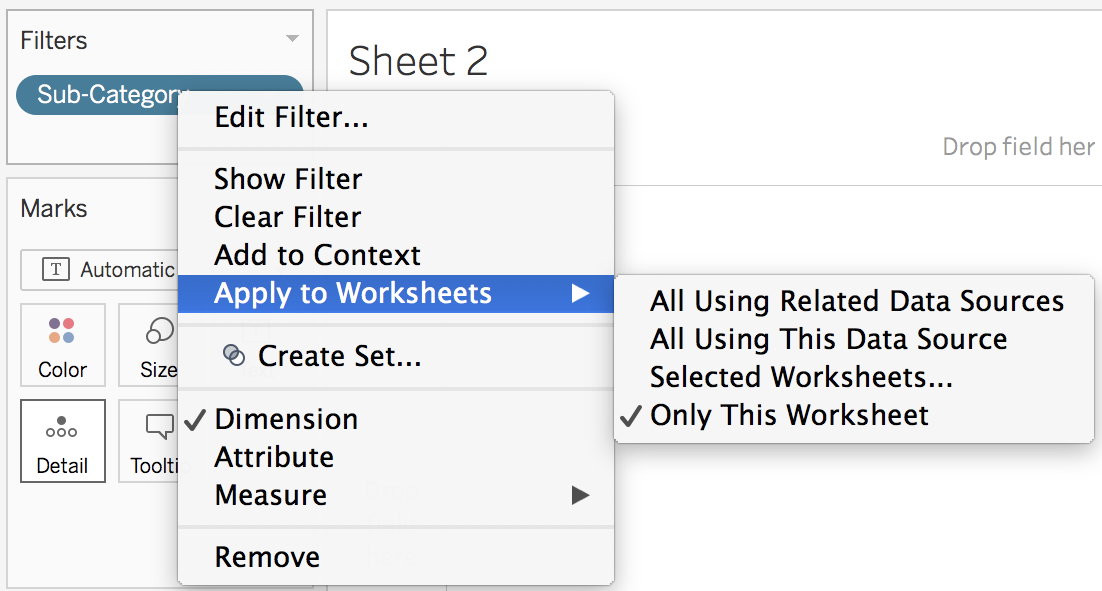
A Filter can be applied on:

  • The current Worksheet you're working on (by default)
  • A list of selected Worksheets (you can select them with a menu)
  • All the Worksheets that use the same Data Source
  • All the Worksheets that use the same or a different Data Source that contains the same filtered field


To decide where a Filter should be applied, right-click on its pill in the Filters shelf, and use the following options:

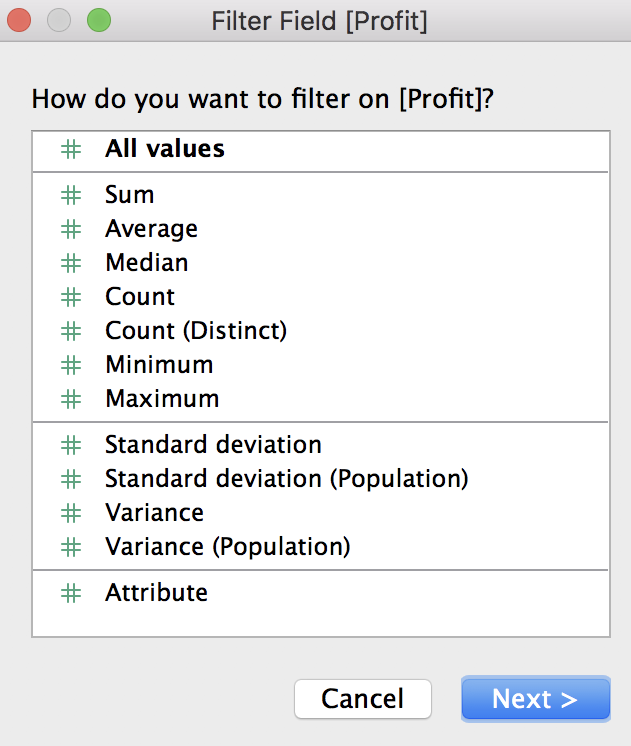
There are differences between a Discrete and a Continuous field, and with Dates compared to other data types.

Filtering a continuous field

If a continuous field is a Measure, a new window opens asking you to choose an aggregation or All values (no aggregation). The following screenshot is an example of adding Profit to a Filter:

After clicking on Next, Tableau opens...

lock icon
The rest of the page is locked
Previous PageNext Page
You have been reading a chapter from
Getting Started with Tableau 2018.x
Published in: Sep 2018Publisher: PacktISBN-13: 9781788838689

Author (1)

author image
Tristan Guillevin

Tristan Guillevin is a Business Analyst at Ogury. In 2017, he won the Iron Viz - the ultimate data visualization battle, organized by Tableau every year in Las Vegas. His passion for data visualization and for Tableau has taken him around the world. He enjoys helping people with Tableau by making webinars, conferences, and writing blog articles.
Read more about Tristan Guillevin