Reader small image

You're reading from  Getting Started with Tableau 2018.x

Product typeBook
Published inSep 2018
PublisherPackt
ISBN-139781788838689
Edition1st Edition
Tools
Right arrow
Author (1)
Tristan Guillevin
Tristan Guillevin
author image
Tristan Guillevin

Tristan Guillevin is a Business Analyst at Ogury. In 2017, he won the Iron Viz - the ultimate data visualization battle, organized by Tableau every year in Las Vegas. His passion for data visualization and for Tableau has taken him around the world. He enjoys helping people with Tableau by making webinars, conferences, and writing blog articles.
Read more about Tristan Guillevin

Right arrow

Worksheet options and format


There are lots of options available in a Worksheet, and you can find them in many different places. You can right-click almost anywhere, and you'll get a list of options. The three significant places to find options are:

  • With a right-click on a pill
  • In the Worksheet menu at the top
  • With a right-click on the View (or on a Mark)

Let's go through a selection of the most useful options for each place, starting with the pill options.

Pill options

All the pill options are available by right-clicking on a pill. There are some differences between Continuous and Discrete pill options. The following screenshot shows the options available for a Continuous pill:

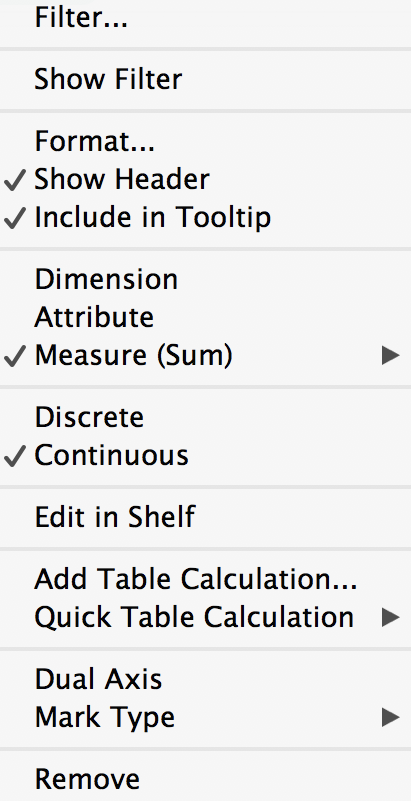
Among the most important options, you'll find the following:

  • Filter...: A shortcut to the pill in the Filters shelf that opens the Edit Filter window
  • Show Filter: Automatically puts the pill in the Filters shelf and displays the quick filter
  • Show Highlighter(only for Discrete pills): Opens the Highlighter card, which allows...
lock icon
The rest of the page is locked
Previous PageNext Page
You have been reading a chapter from
Getting Started with Tableau 2018.x
Published in: Sep 2018Publisher: PacktISBN-13: 9781788838689

Author (1)

author image
Tristan Guillevin

Tristan Guillevin is a Business Analyst at Ogury. In 2017, he won the Iron Viz - the ultimate data visualization battle, organized by Tableau every year in Las Vegas. His passion for data visualization and for Tableau has taken him around the world. He enjoys helping people with Tableau by making webinars, conferences, and writing blog articles.
Read more about Tristan Guillevin