Reader small image

You're reading from  Getting Started with Tableau 2018.x

Product typeBook
Published inSep 2018
PublisherPackt
ISBN-139781788838689
Edition1st Edition
Tools
Right arrow
Author (1)
Tristan Guillevin
Tristan Guillevin
author image
Tristan Guillevin

Tristan Guillevin is a Business Analyst at Ogury. In 2017, he won the Iron Viz - the ultimate data visualization battle, organized by Tableau every year in Las Vegas. His passion for data visualization and for Tableau has taken him around the world. He enjoys helping people with Tableau by making webinars, conferences, and writing blog articles.
Read more about Tristan Guillevin

Right arrow

Using Tableau for data exploration


Tableau can be used to answer business questions easily and visually. In the section, we'll explore our data to find insights. For this example, we use the Sample - Superstore dataset again. If you are starting here, please refer to the preceding Connect to data section. If you're continuing from the previous exercise, create a new Worksheet.

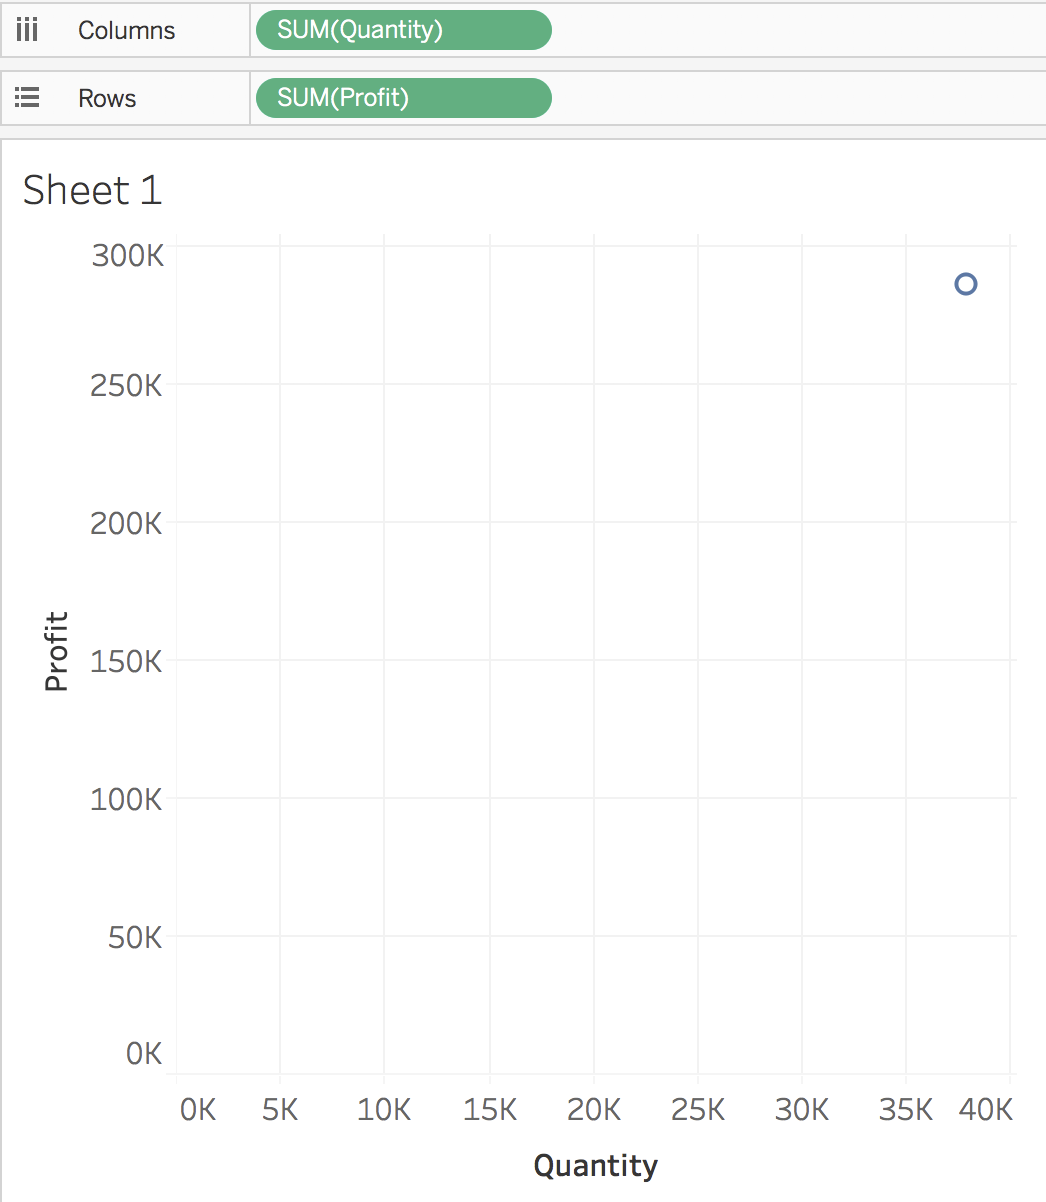
Let's start by building a scatterplot. It's a visualization that allows you to analyze two Measures at the same time:

  1. Double-click on Profit then on Quantity. You should see one mark that shows the sum of sales and quantity:

Are there unprofitable sub-categories?

  1. Drag and drop Sub-Category to Label. You should see now one mark per Sub-Category with, for some, their label:

Supplies, Bookcases, and Tables are unprofitable sub-categories. Now that you have answered your first question, you have two options: be happy because that's all you wanted to know, or go deeper. Let's try the second option.

  1. Select the three nonprofitable...
lock icon
The rest of the page is locked
Previous PageNext Page
You have been reading a chapter from
Getting Started with Tableau 2018.x
Published in: Sep 2018Publisher: PacktISBN-13: 9781788838689

Author (1)

author image
Tristan Guillevin

Tristan Guillevin is a Business Analyst at Ogury. In 2017, he won the Iron Viz - the ultimate data visualization battle, organized by Tableau every year in Las Vegas. His passion for data visualization and for Tableau has taken him around the world. He enjoys helping people with Tableau by making webinars, conferences, and writing blog articles.
Read more about Tristan Guillevin