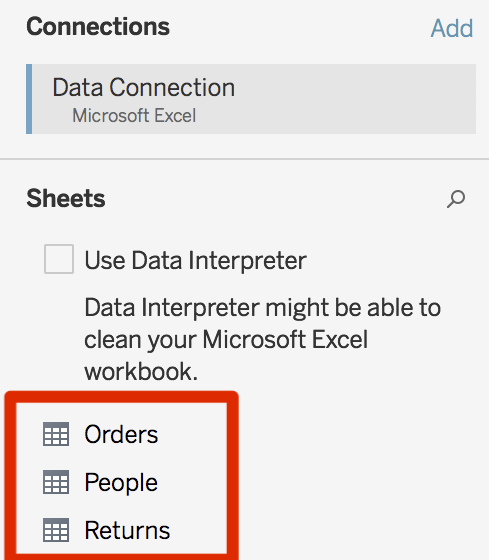
The first thing you usually do when opening Tableau is to connect to a dataset. You already had a glimpse of data connection in the previous chapter when we used an Excel file. In this chapter, you'll see the most important options that Tableau offers when connecting to data. Here are our main focuses:
- Data connection
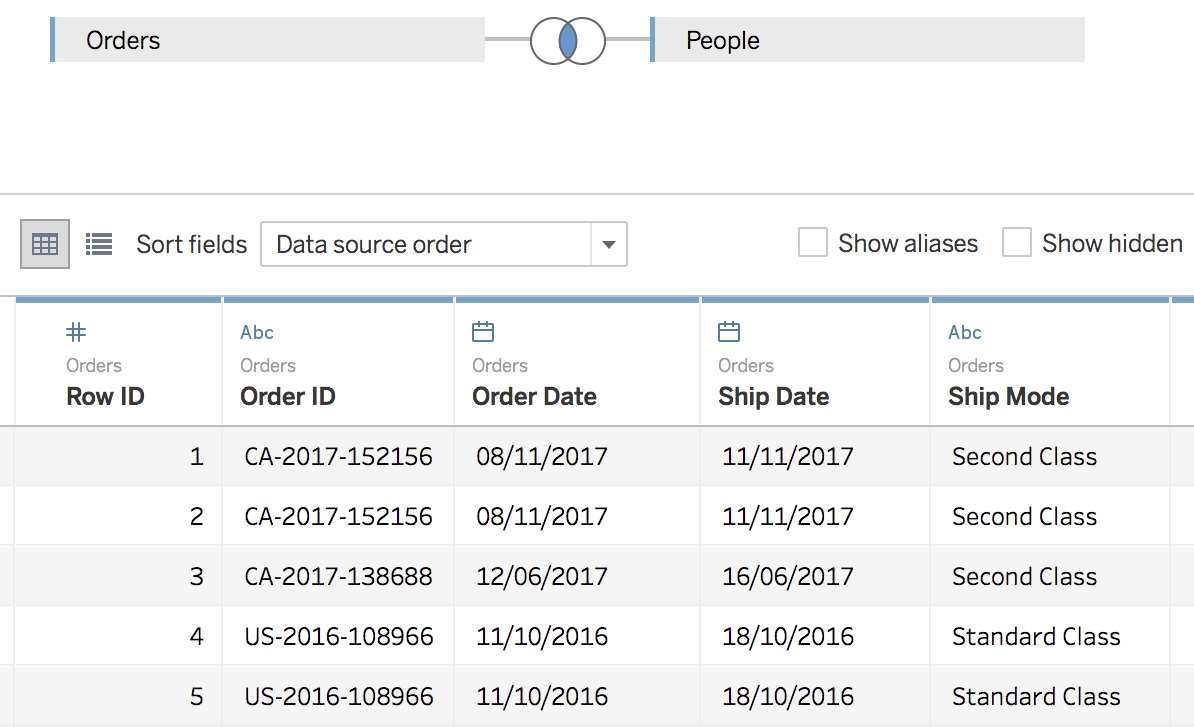
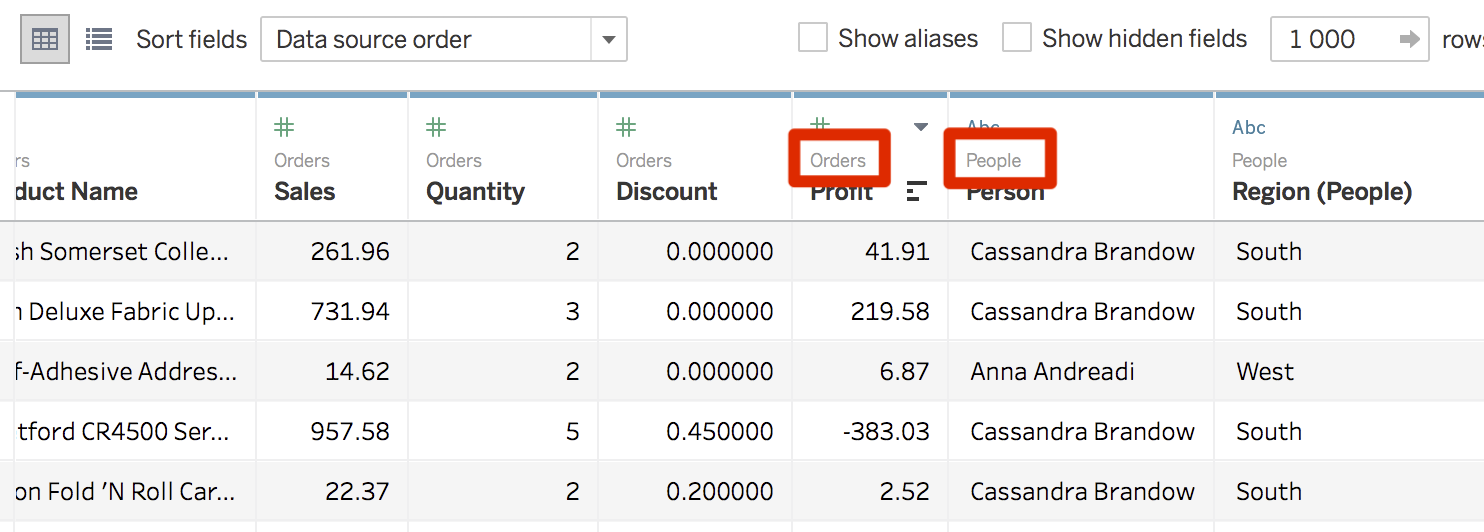
- Join data easily
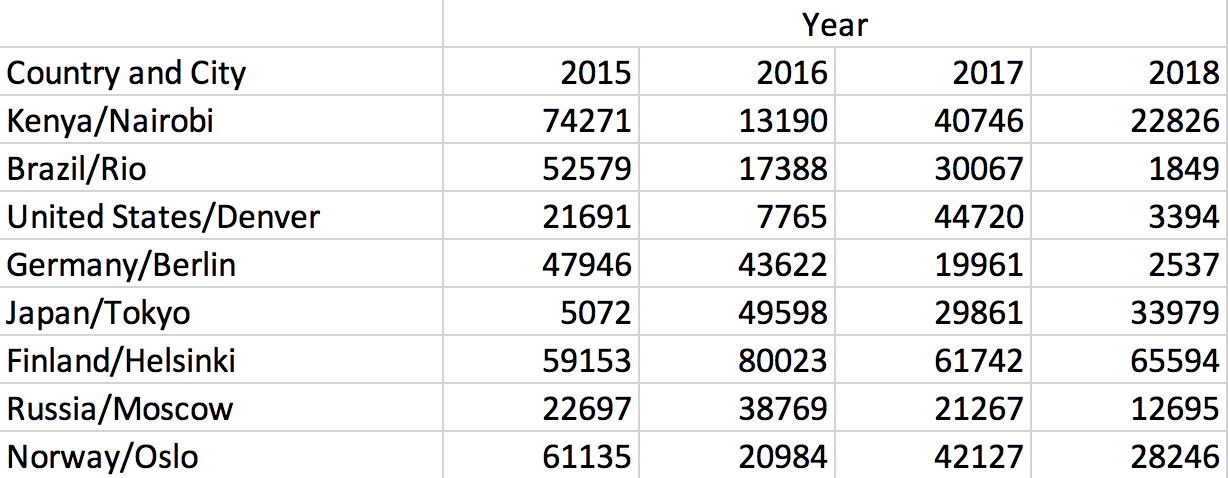
- Union your data
- Simple transformation
To harmonize all the different words among the various data providers, we'll use the following terms through the chapter:
Let's now start with some...