Reader small image

You're reading from  Getting Started with Tableau 2018.x

Product typeBook
Published inSep 2018
PublisherPackt
ISBN-139781788838689
Edition1st Edition
Tools
Right arrow
Author (1)
Tristan Guillevin
Tristan Guillevin
author image
Tristan Guillevin

Tristan Guillevin is a Business Analyst at Ogury. In 2017, he won the Iron Viz - the ultimate data visualization battle, organized by Tableau every year in Las Vegas. His passion for data visualization and for Tableau has taken him around the world. He enjoys helping people with Tableau by making webinars, conferences, and writing blog articles.
Read more about Tristan Guillevin

Right arrow

Join data easily


A Join creates a single Data Source with columns coming from two (or more) tables. How do Joins work? How can you create them? Are there risks? You'll learn everything in this section.

The Join principle

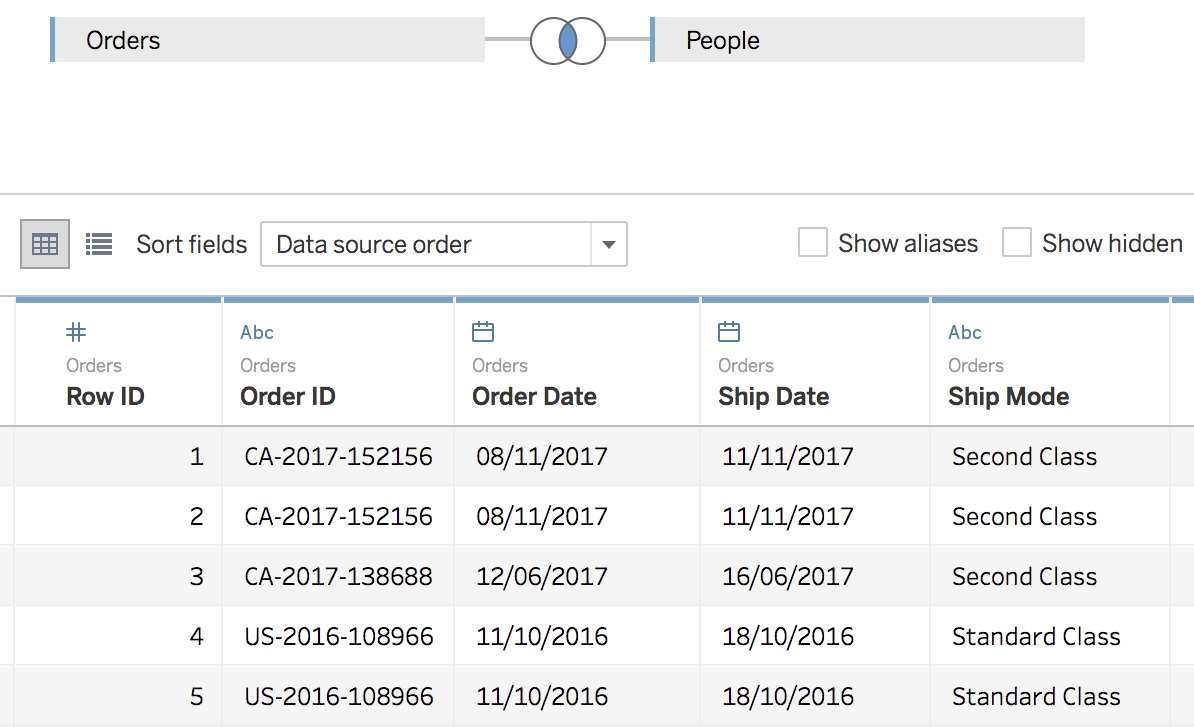
So far, we've only used one table. A Join is automatically created when using two or more tables. There is always a left table and a right table. In the following screenshot, you see a Join between Orders (the left table), and People (the right table):

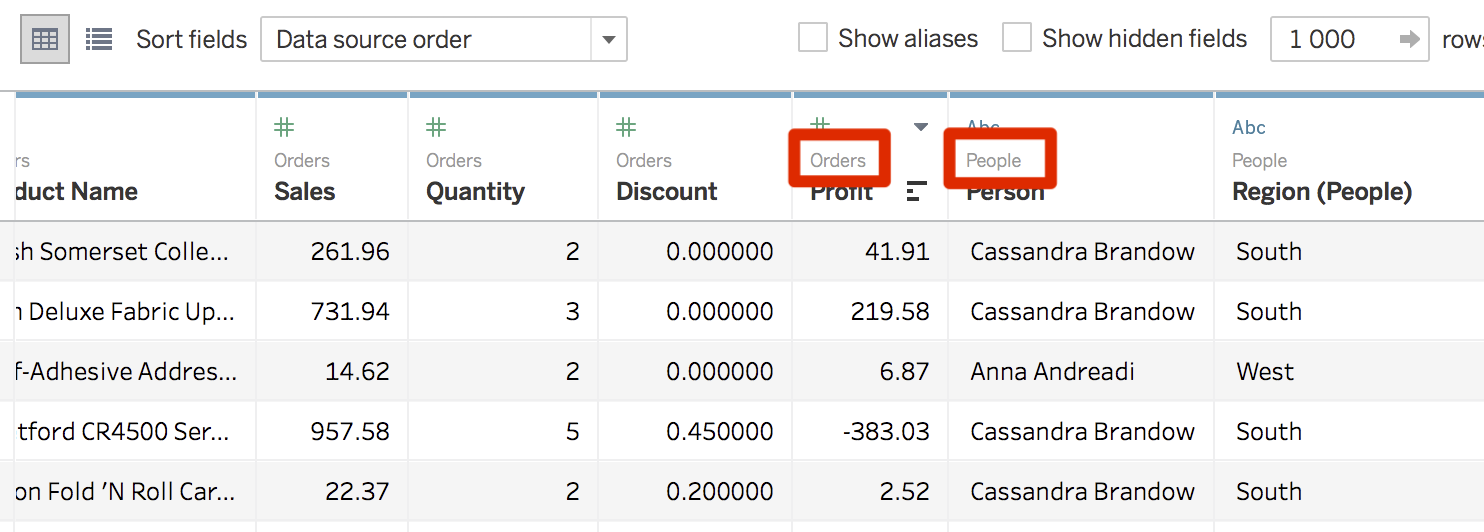
The result of a Join is a Data Source that contains the columns from the different tables. As highlighted in the screenshot, you can see that the Profit column comes from the Orders table, and the Person column comes from the People table:

There are four different types of join. Discover them in the next section.

Join requirements and types

To create a Join between two tables, you need at least one column in each table that contains the same values. These common columns create the link between the two tables. When you create a Join...

lock icon
The rest of the page is locked
Previous PageNext Page
You have been reading a chapter from
Getting Started with Tableau 2018.x
Published in: Sep 2018Publisher: PacktISBN-13: 9781788838689

Author (1)

author image
Tristan Guillevin

Tristan Guillevin is a Business Analyst at Ogury. In 2017, he won the Iron Viz - the ultimate data visualization battle, organized by Tableau every year in Las Vegas. His passion for data visualization and for Tableau has taken him around the world. He enjoys helping people with Tableau by making webinars, conferences, and writing blog articles.
Read more about Tristan Guillevin