

Working with Window and Cartesian Coordinates
Remember drawing an x- and y-axis on paper in school and then plotting a point based on its x and y value? This was the beginning of your journey into the Cartesian coordinate system. You likely use it every day to locate positions on maps, in drawings, or on your computer screen. Fundamentally, it is a way of uniquely representing a location with a single value on a line, a pair of numerical coordinates on a plane (2D), or with a triplet of values in 3D. In fact, Cartesian coordinates even extend into four, five, and upward dimensions, though they aren’t relevant here.
The axes of the system have evenly spaced measurements, much like a ruler, and are used to determine where a location made up of coordinates is placed. For example, in one dimension there is only one axis, and going with popular convention, we will call this x. To plot x = 5 is to locate the value of 5 on the axis and place a point there. In two dimensions with the axes, x and y, and the coordinate (2, 3) where x is the first value and y is the latter, a point is placed where these values intersect. These examples are illustrated in Figure 1.11.
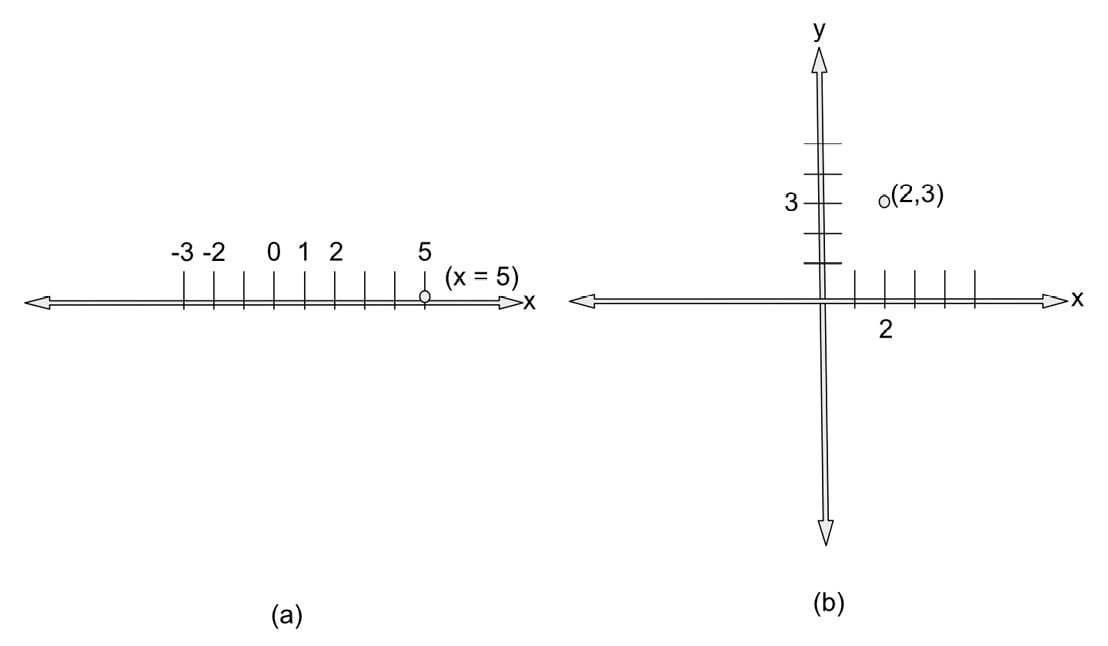
Figure 1.11: Cartesian plots of x = 5 in one dimension (a) and (2,3) in two dimensions (b)
The majority (if not all) of graphics applications work in two and three dimensions and as such we will reduce our discussion in this book to those with most applications in 3D. While the computer screen is 2D, it is also used to fake 3D; however, the mathematics applied still occurs within 3D calculations with the x-, y-, and z- axes. In working with graphics, we must therefore be aware of different ways of viewing Cartesian coordinates. In the next exercise, we will show the plotting of points in 2D and how Cartesian coordinates work in graphics.
Let’s do it…
To create a window with some plotted points defined by Cartesian coordinates, we perform the following steps:
- Create a new Python script called
PlotPixel.pyand add the following code (the differences betweenHelloWindow.pyand this script are shown in bold):import pygame
pygame.init()
screen_width = 1000
screen_height = 800
screen = pygame.display.set_mode((screen_width,
screen_height))
done = False
white = pygame.Color(255,255,255)
while not done:
for event in pygame.event.get():
if event.type == pygame.QUIT:
done = True
screen.set_at((100, 100),white)
pygame.display.update()
pygame.quit()
- The
set_at()method will plot a single pixel point in the color of your choosing; in this case, the pixel will be white at the coordinates x = 100, and y = 100. To see this in action, run the script. Remember that you will need to right-click on the filename in the Project window and select Run before you’ll be able to run it from the little green icon at the top-right of the window. Now, try plotting another point at (200, 200). You can do this with a secondset_at()call, for example, as follows:screen.set_at((200, 200),white)
The resulting screen image is shown in Figure 1.12 (note that the pixel locations have been enhanced with white squares so you can see them in print).
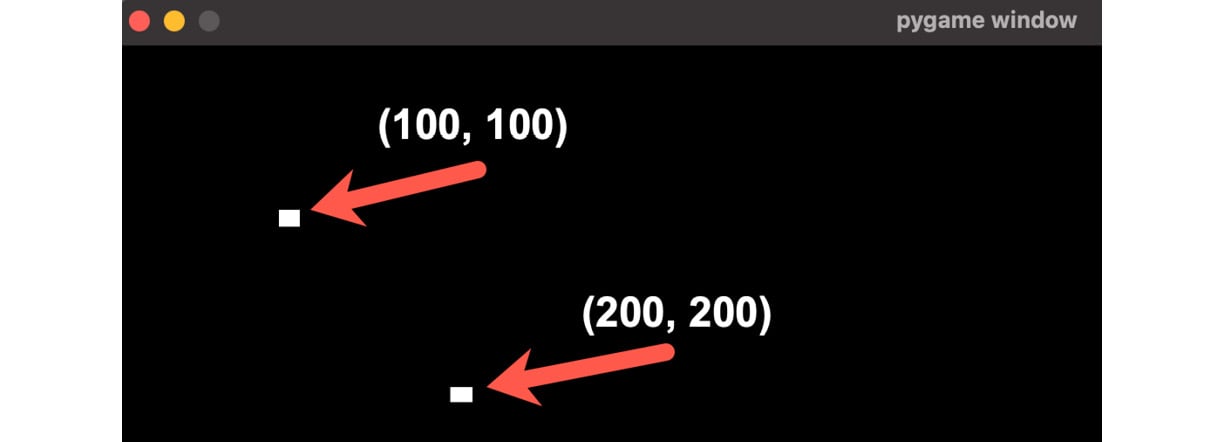
Figure 1.12: Pixel locations when plotted in a default window
What did you notice about the location of the pixels? Based on their position, where would you conclude the origin (0,0) of the window to be?
If you said the upper-left corner of the window, you would be correct. We all learn in school that the positive Cartesian coordinate system runs for positive x values to the right along the page and for positive y values up the page. However, in computer graphics, this isn’t true, and the coordinate systems will follow different conventions depending on the platform and tools. In this case, the x coordinates run as you would expect but the y values are inverted with positive y values going down the page.
Why? Because early graphics displays used physical, electron scan lines beginning in the upper-left corner of the display, scanning across, and then down. It doesn’t need to be like this anymore, but it just is.
Most game engines transform these coordinates so that the y-axis faces up.
However, as the astute computer graphics programmer that you are, it’s always best to figure out which way is up according to the coordinate system you are working with, either through the documentation or by running a few experiments of your own.
- If you would prefer the origin of the coordinate system to be shown in the lower left-hand corner, then you can modify the coordinates with a simple method as follows:
import pygame
pygame.init()
screen_width = 1000
screen_height = 800
screen = pygame.display.set_mode((screen_width,
screen_height))
done = False
white = pygame.Color(255, 255, 255)
def to_pygame_coordinates (display, x, y):
return x, display.get_height() - y
while not done:
for event in pygame.event.get():
if event.type == pygame.QUIT:
done = True
screen.set_at(to_pygame_coordinates
(screen, 100,100),
white)
screen.set_at(to_pygame_coordinates
(screen, 200,200),
white)
pygame.display.update()
pygame.quit()
In the preceding code, the new to_pygame_coordinates() method flips the y coordinate based on the screen height and returns a new set of (x, y) values for plotting the pixel basing the origin of the screen in the lower-left corner of the window. Though, after you’ve worked with graphics for a while, you’ll get used to the upper-left origin and as such we will assume the origin of the coordinates (0,0) to be the upper-left of the graphics window, unless stated otherwise.
Drawing rectangles
In the preceding figure, we used rectangles to enhance the size of the pixels to make them visible. To draw a point in a location in the window that is larger than a single pixel, we can draw a small rectangle or square instead. To do this, the code is as follows:
import pygame
pygame.init()
screen_width = 1000
screen_height = 800
screen = pygame.display.set_mode((screen_width, screen_height))
done = False
white = pygame.Color(255, 255, 255)
def to_pygame_coordinates(display, x, y):
return x, display.get_height() - y
while not done:
for event in pygame.event.get():
if event.type == pygame.QUIT:
done = True
position = to_pygame_coordinates
(screen, 100, 100)
pygame.draw.rect(screen, white,
(position[0],position[1],
10, 10))
pygame.display.update()
pygame.quit()
The definition of pygame.draw.rect can be found at https://www.pygame.org/docs/ref/draw.html#pygame.draw.rect. In short, a rectangle requires a screen, color, a starting location (identified by position in the code), and a width and height (we are using 10 in this example).
This task has shown you how to work with a window and the coordinates used within it. It’s a valuable skill as pixel-by-pixel is how every graphics application is written. It’s the nature of the display devices we use.
Your Turn…
Note
After most code-along exercises in the Let’s do it… sections of this book, you will find a section like this that encourages you to apply the skills you’ve learned thus far. The answers to these exercises can be found at the end of the chapter.
Exercise A.
Find an image of the constellation representing the Leo star sign and draw those series of stars on the screen. An example of its layout is shown in Figure 1.13. Notice that we have also included a size factor for each star based on its relative brightness, where we used rectangles of different sizes to draw each one.
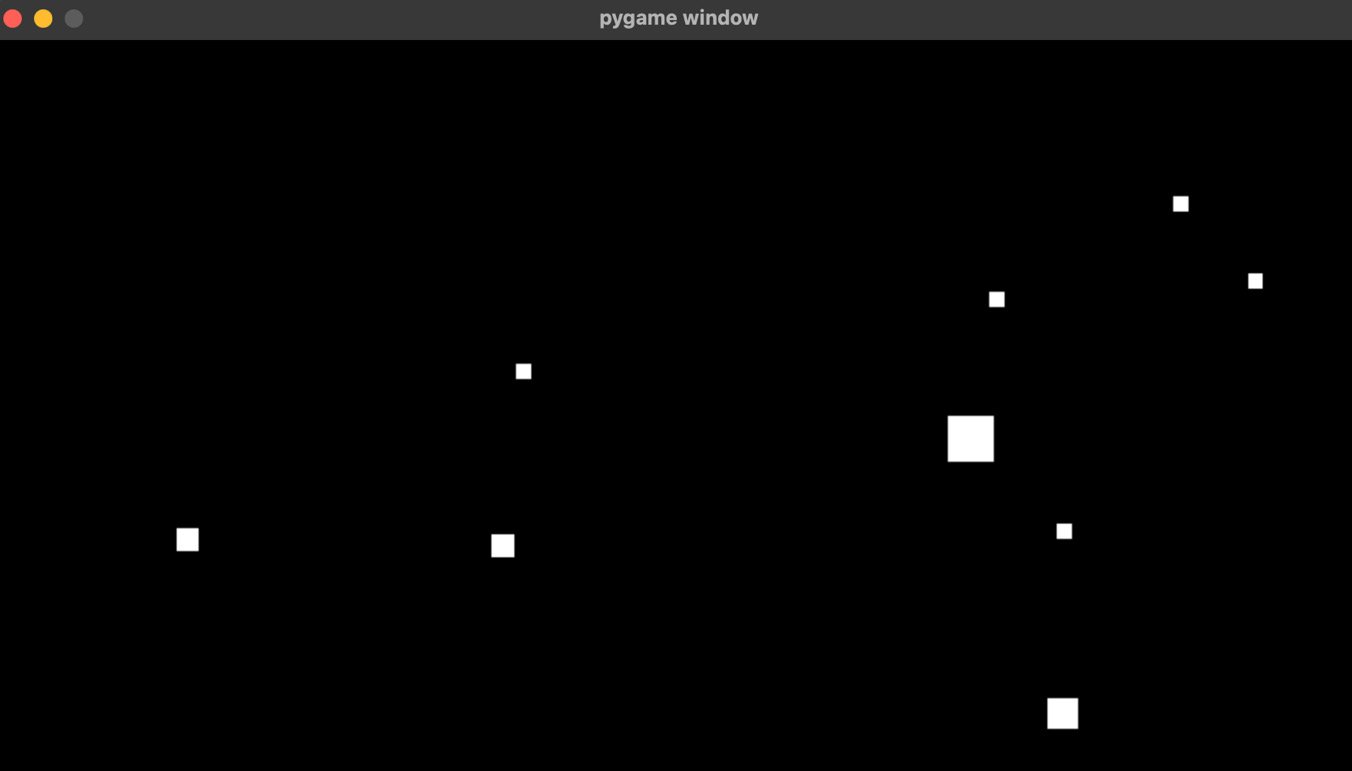
Figure 1.13: The constellation of Leo
When you have completed this and reviewed the answer at the end of the chapter, why not try and recreate your own star sign?