
Inserting and modifying a map
When I say you need to start thinking visually when creating presentations, it means to stop being on autopilot when creating your content. Any content you need to deliver needs to be examined to seek visual ways to create it. Let’s look at an example of content that can be greatly improved with one of PowerPoint’s features (Office 365 (O365) only): inserting a map. For the slide example in Figure 6.1, I created a table with data showing four Canadian provinces that should have more than 6 million people by 2043:
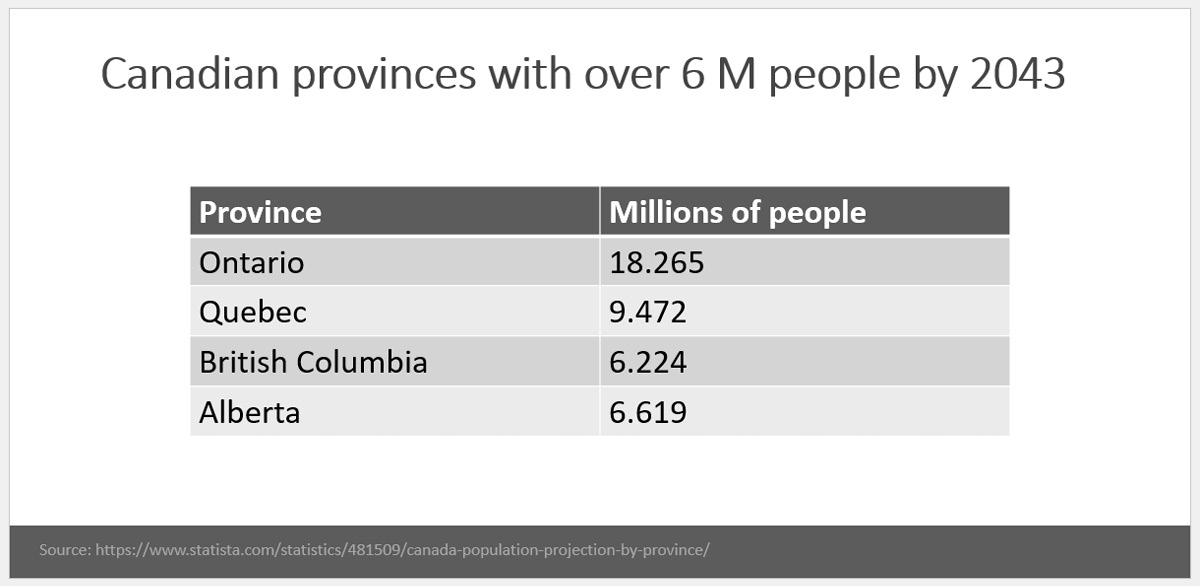
Figure 6.1 – Table listing four Canadian provinces with their population by 2043
It is not a bad slide per se, but it does lack visual appeal. Instead, we can leverage PowerPoint’s map feature so that we can make each province visible within Canada, as in Figure 6.2:
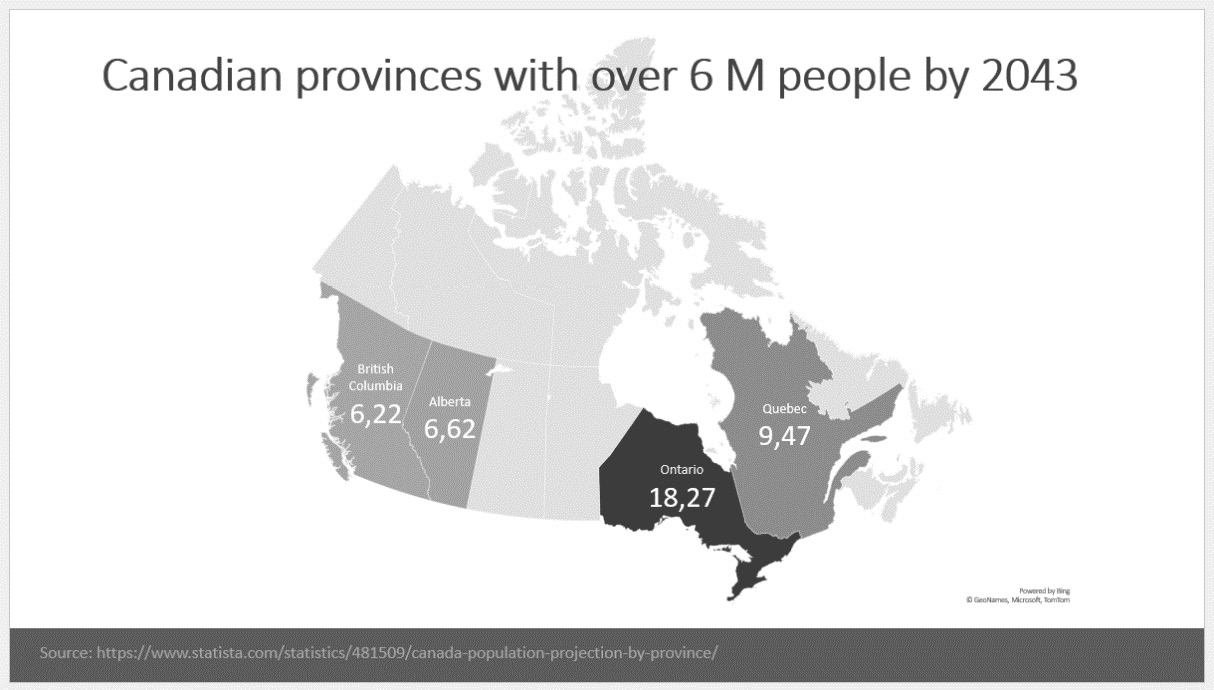
Figure 6.2 – Population information shown in a map of Canada
As you can see, it adds...