


Visualizing Loki log data with Explore
Go to Explore and confirm that Loki is set as your data source. Welcome to Loki! Things may look a bit different from what you may remember from using Explore with other data sources. On the far right of Kick start your query, click on Builder mode. Let’s take a quick tour of some of Loki’s UI features:
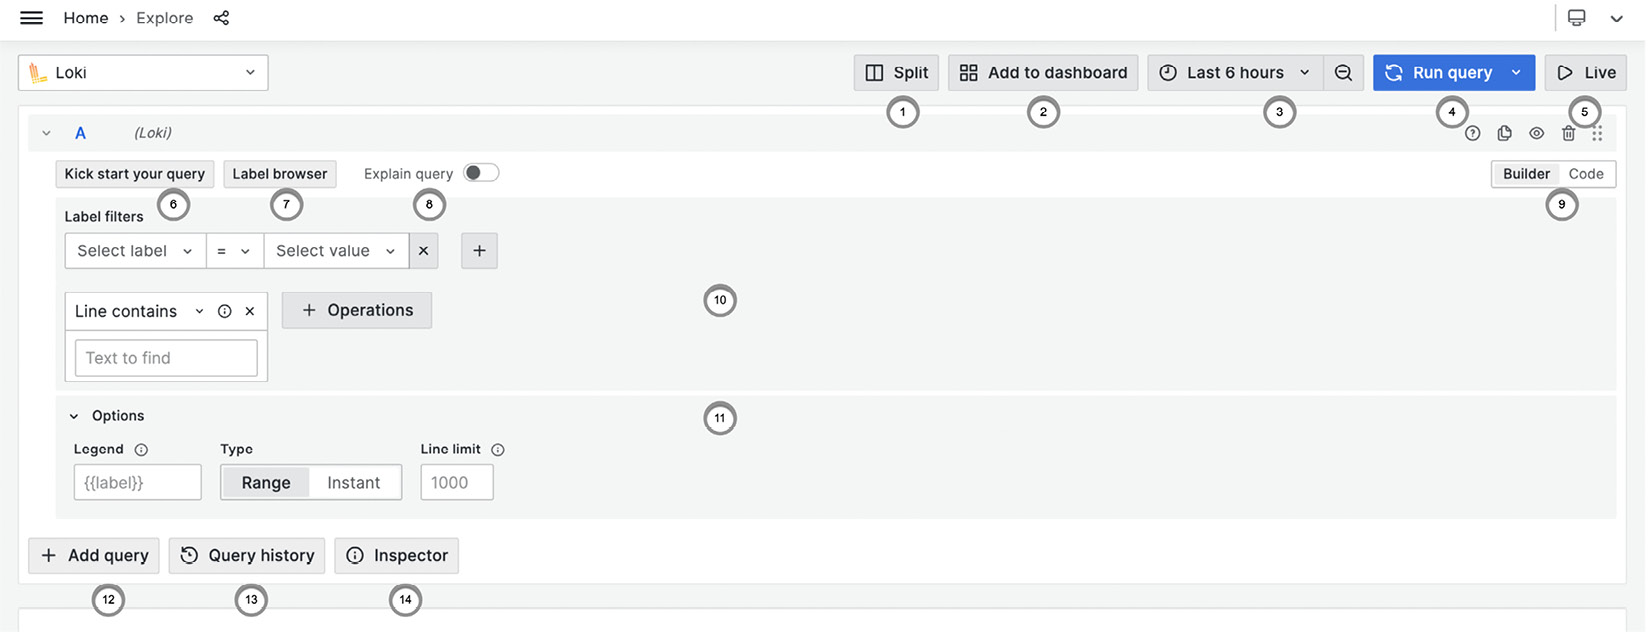
Figure 13.2 – Loki data source in Explore
The following features are highlighted in the preceding figure:
- Split: Splits the window into two queries that are side by side. For example, you can put logs on one side and metrics on the other.
- Add to dashboard: Captures your current query and creates a panel on a dashboard.
- Time frame selection. Selects the time period for the query.
- Run query: Use the dropdown to set a continuous refresh rate for the query.
- Live: This continuously displays the last few loglines matching the query. The button switches to a pause or stop selector...