Reader small image

You're reading from  Learn Grafana 10.x - Second Edition

Product typeBook
Published inDec 2023
PublisherPackt
ISBN-139781803231082
Edition2nd Edition
Right arrow
Author (1)
Eric Salituro
Eric Salituro
author image
Eric Salituro

Eric Salituro is currently a Software Engineering Manger with the Enterprise Data and Analytics Platform team at Zendesk. He has an IT career spanning over 30 years, over 20 of which were in the motion picture industry working as a pipeline technical director and software developer for innovative and creative studios like DreamWorks, Digital Domain, and Pixar. Before moving to Zendesk, he worked at Pixar helping to manage and maintain their production render farm as a Senior Software Developer. Among his accomplishments there was the development of a Python API toolkit for Grafana aimed at streamlining the creation of rendering metrics dashboards
Read more about Eric Salituro

Right arrow

Exploring Log Data with Grafana’s Loki

In this final chapter of Part 2, Real-World Grafana, we’re going to shift gears a bit. So far, we’ve been operating under a dashboard-oriented paradigm in terms of how we use Grafana. This is not too unusual since Grafana has always been structured around the dashboard metaphor. The introduction of Explore in Grafana 6 brought an alternative workflow – one that is data-driven and, dare I say it, exploratory.

Grafana really shines when working with numerical and some forms of textual data, but what if the data includes substantial amounts of log data? Every day, countless applications disgorge not only standard numerical metrics but also copious text logs. If you’ve ever enabled debug mode in an application, then you’ve seen how a few meager kilobytes of information can quickly become a flood of gigabytes worth of repetitive, inscrutable gibberish. Diagnosing a problem by enabling the debugging code...

Technical requirements

The tutorial code, dashboards, and other helpful files for this chapter can be found in this book’s GitHub repository at https://github.com/PacktPublishing/Learn-Grafana-10/tree/main/Chapter13.

Loading system logs into Loki

To get started, cd to the Chapter13 directory in your clone of this book’s repository.

To stand up a Loki logging pipeline, we’ll need to set up a series of services in Docker Compose. In our initial deployment, we will set up three services: loki, promtail, and grafana. By now, adding these services to a docker-compose.yml file should be familiar and straightforward.

Networking our services

Before we start up our services, we will want to establish a network that links them all together. All services started from a single docker-compose.yml file that shares a common network called myapp_default. We will not use the default name and instead define the network name for our service as loki. There is no requirement to do this, but it demonstrates how you can link up multiple services to not just one default network but potentially several in a more complex network topology.

This is how we will start off our docker-compose.yml file...

Visualizing Loki log data with Explore

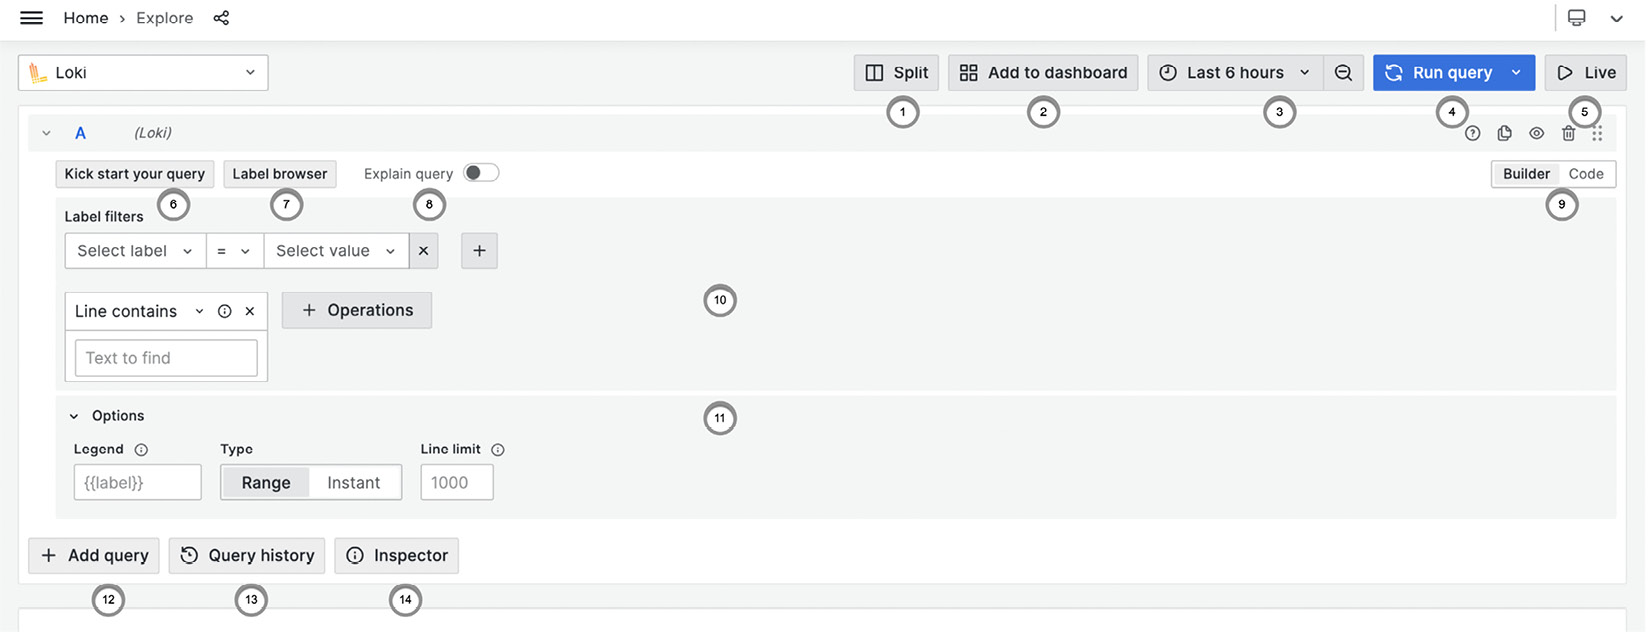
Go to Explore and confirm that Loki is set as your data source. Welcome to Loki! Things may look a bit different from what you may remember from using Explore with other data sources. On the far right of Kick start your query, click on Builder mode. Let’s take a quick tour of some of Loki’s UI features:

Figure 13.2 – Loki data source in Explore

Figure 13.2 – Loki data source in Explore

The following features are highlighted in the preceding figure:

  1. Split: Splits the window into two queries that are side by side. For example, you can put logs on one side and metrics on the other.
  2. Add to dashboard: Captures your current query and creates a panel on a dashboard.
  3. Time frame selection. Selects the time period for the query.
  4. Run query: Use the dropdown to set a continuous refresh rate for the query.
  5. Live: This continuously displays the last few loglines matching the query. The button switches to a pause or stop selector...

Simulating logs with flog

As-is, this is a fairly limited view of Loki’s capabilities, largely because we haven’t fed it some real logging to work with. Let’s fix that by first adding some live logs and then configuring Promtail to scrape them. Taking a cue from the Loki documentation, we’ll use an open source logging generator called flog to generate fake logging. Next, we’ll create a configuration file for Promtail that will scrape those logs in real time.

flog is available as a Docker container, so we just need to add it as a service to our docker-compose.yml file:

    flog:
        image: mingrammer/flog:latest
    command: -l -d 1

The service entry for flog is very simple: pull the latest image and run it with the -l command-line option for continuous looping, and -d 1 to run with a delay interval of 1 second so that we don’t overwhelm Promtail.

...

Alternative Docker log capture

If you are having trouble with the Docker socket method of scraping logs, or for security reasons can’t use that method, the folks at Grafana have provided a log driver for Docker that can deliver logs to Loki directly, thus bypassing Promtail entirely. It requires downloading a special Loki log driver for Docker and updating the docker-compose.yml file so that it includes driver-specific configuration. To download and install the driver, run the following command:

% docker plugin install grafana/loki-docker-driver:latest --alias loki --grant-all-permissions

The plugin installation command will download the latest driver and install it with an alias of loki (so that we can access it easily from Docker Compose), with wide-open permissions. To confirm the installation, run the following command:

% docker plugin ls
ID NAME DESCRIPTION ENABLED
692bec0b6ade loki:latest Loki Logging Driver true

If you get true as output, then your plugin loaded...

Querying logs and metrics with Explore

Adding Prometheus metrics to the mix is relatively simple: we just need to add a new Prometheus service while sending its logs to Loki to be aggregated (why not?). We’ll also need to configure Prometheus to scrape the metrics endpoints of our services. We already did this earlier in this book, so it should be no problem for us to configure the scrapers for each service.

First, let’s add Prometheus to our Docker Compose:

    prometheus:
        image: "prom/prometheus:latest"
    ports:
        - "9090:9090"
    volumes:
        - "${PWD-.}/prometheus/etc:/etc/prometheus"
    command: --config.file=/etc/prometheus/prometheus-config.yaml
    networks:
     ...

Summary

We’ve reached the end of Chapter 13, Exploring Log Data with Grafana’s Loki. In this chapter, we learned how to use Explore with the Loki data source to perform ad hoc analysis of logs and aggregated log metrics. We deployed a Loki pipeline to aggregate filesystem log files and the logs generated by our Docker containers. We used Prometheus to collect dozens of metrics about those container services. Finally, using the Split feature, we made side-by-side comparisons of both log and service metrics.

With that, we’ve also reached the end of Part 2 – Real-World Grafana. In Part 3 – Managing Grafana, we’ll step out of our role as an end user of Grafana and into that of an administrator. We’ll learn about how to manage dashboards, users, and teams. We’ll also learn how to secure the Grafana server by authenticating our users with services such as OAuth2 and LDAP. Finally, we’ll explore the rapidly expanding world...

lock icon
The rest of the chapter is locked
You have been reading a chapter from
Learn Grafana 10.x - Second Edition
Published in: Dec 2023Publisher: PacktISBN-13: 9781803231082
Register for a free Packt account to unlock a world of extra content!
A free Packt account unlocks extra newsletters, articles, discounted offers, and much more. Start advancing your knowledge today.
undefined
Unlock this book and the full library FREE for 7 days
Get unlimited access to 7000+ expert-authored eBooks and videos courses covering every tech area you can think of
Renews at $15.99/month. Cancel anytime

Author (1)

author image
Eric Salituro

Eric Salituro is currently a Software Engineering Manger with the Enterprise Data and Analytics Platform team at Zendesk. He has an IT career spanning over 30 years, over 20 of which were in the motion picture industry working as a pipeline technical director and software developer for innovative and creative studios like DreamWorks, Digital Domain, and Pixar. Before moving to Zendesk, he worked at Pixar helping to manage and maintain their production render farm as a Senior Software Developer. Among his accomplishments there was the development of a Python API toolkit for Grafana aimed at streamlining the creation of rendering metrics dashboards
Read more about Eric Salituro