Reader small image

You're reading from  Learn Grafana 10.x - Second Edition

Product typeBook
Published inDec 2023
PublisherPackt
ISBN-139781803231082
Edition2nd Edition
Right arrow
Author (1)
Eric Salituro
Eric Salituro
author image
Eric Salituro

Eric Salituro is currently a Software Engineering Manger with the Enterprise Data and Analytics Platform team at Zendesk. He has an IT career spanning over 30 years, over 20 of which were in the motion picture industry working as a pipeline technical director and software developer for innovative and creative studios like DreamWorks, Digital Domain, and Pixar. Before moving to Zendesk, he worked at Pixar helping to manage and maintain their production render farm as a Senior Software Developer. Among his accomplishments there was the development of a Python API toolkit for Grafana aimed at streamlining the creation of rendering metrics dashboards
Read more about Eric Salituro

Right arrow

Organizing Dashboards and Folders

Welcome to the first chapter of Part 3, Managing Grafana. By now, you’ve created some awesome dashboards. Maybe you’ve even set up valuable alerts with some of those dashboards, and now you’re in the enviable position of being your team’s Grafana guru. That great honor will be accompanied by great responsibilities. You’re now the de facto manager of your Grafana server and all the requisite administrative tasks that come along for the ride.

In this section of the book, we’ll cover some of the more common aspects of Grafana management, from keeping your dashboards tidy to managing and authenticating your users and teams, to monitoring your applications in the cloud. In Part 2, Real-World Grafana, we used various realistic scenarios to drive the descriptions and the associated exercises. In this section, we will present the material in a more straightforward how-to style, and along the way, cover use cases...

Managing dashboards and folders

By now, you’ve probably created at least a handful of dashboards, if only to work through the examples in this book. Ideally, you’re well on your way to creating many more, along with other members of your team, unit, and even your entire company. What you’ll quickly find – if you haven’t already – is that you’ve ended up with a number of dashboards in various stages of development and potentially connected to a number of data sources, all of them lying around in the dashboard display.

Conceptually, Grafana provides four classification schemes aimed at helping you identify dashboards to satisfy common organizational needs. The first is what I call a significance-based scheme, which identifies the most important dashboard through a starred or favorited designation. The second is a structure-based scheme, which places dashboards into an arbitrary hierarchical structure of folders. The third scheme is...

Starring and tagging dashboards

Our previous sections mostly dealt with the key structural aspects of a dashboard: the name and its location in a specific folder. We will now turn to more semantic aspects, ones that are best described in terms of dashboard metadata, namely dashboard stars and labels. As we saw in Chapter 10, Working with Advanced Dashboard Features and Elasticsearch, dashboard tags may prove useful when linking dashboards, but that’s not the case for tags or stars, as we’re about to find out.

Marking dashboards as favorites

Starred dashboards are mostly useful for when you want to highlight certain dashboards as important or otherwise memorable to you. They can be for bookmarking frequently accessed dashboards or for marking dashboards as needing some kind of special attention.

Starring dashboards is even easier than tagging:

  1. Load up a dashboard.
  2. Click the star icon to Mark as favorite, as shown in the following screenshot:
...

Building and running dashboard playlists

A dashboard playlist is a selection of dashboards that can be played in a looped sequence. Any dashboard can appear in such a playlist. A playlist consists of one or more dashboards displayed in a sequence, separated by a specified interval. They’re typically used to create an automated display cycle of dashboards for unattended venues such as kiosks or operation centers.

Creating a playlist

Before we can start running a playlist, we’ll need to create one. The Playlists page can be found under the Dashboards main menu. Follow these steps:

  1. Under Dashboards on the main menu, select Playlists.
  2. Click New Playlist.
  3. Set a Name for the playlist. You will not be able to save the playlist until you set the Name.
  4. Set the time Interval between dashboards.
  5. Select a dashboard from the Add by title drop-down menu to add a dashboard to the playlist. You can also add tagged dashboards by selecting tags from the Add...

Exploring the Dashboard list panel

If you’ve taken a look at the Home dashboard, then you’re already familiar with the dashboard list panel visualization. You can set the dashboard list visualization for any panel by selecting it from the visualization dropdown in edit mode. It typically displays starred dashboards (for quick reference) and a list of recently visited dashboards. It can also be configured with several more options. Let’s open it up and see what else we can configure it to do.

Setting Dashboard list panel options

In the Dashboard list section of the panel edit pane are the following settings and descriptions:

  • Include current time range: Carries over the current time range to the selected dashboard
  • Include current template variable values: Carries over the current template variable settings to the selected dashboard
  • Starred: Enables display of starred dashboards
  • Recently viewed dashboards: Enables display of recently viewed...

Duplicating dashboards

If you want to experiment with changes to a dashboard or you want to propagate a dashboard to another organization or even another server, there are two ways to duplicate or copy a dashboard.

Internal dashboard duplications

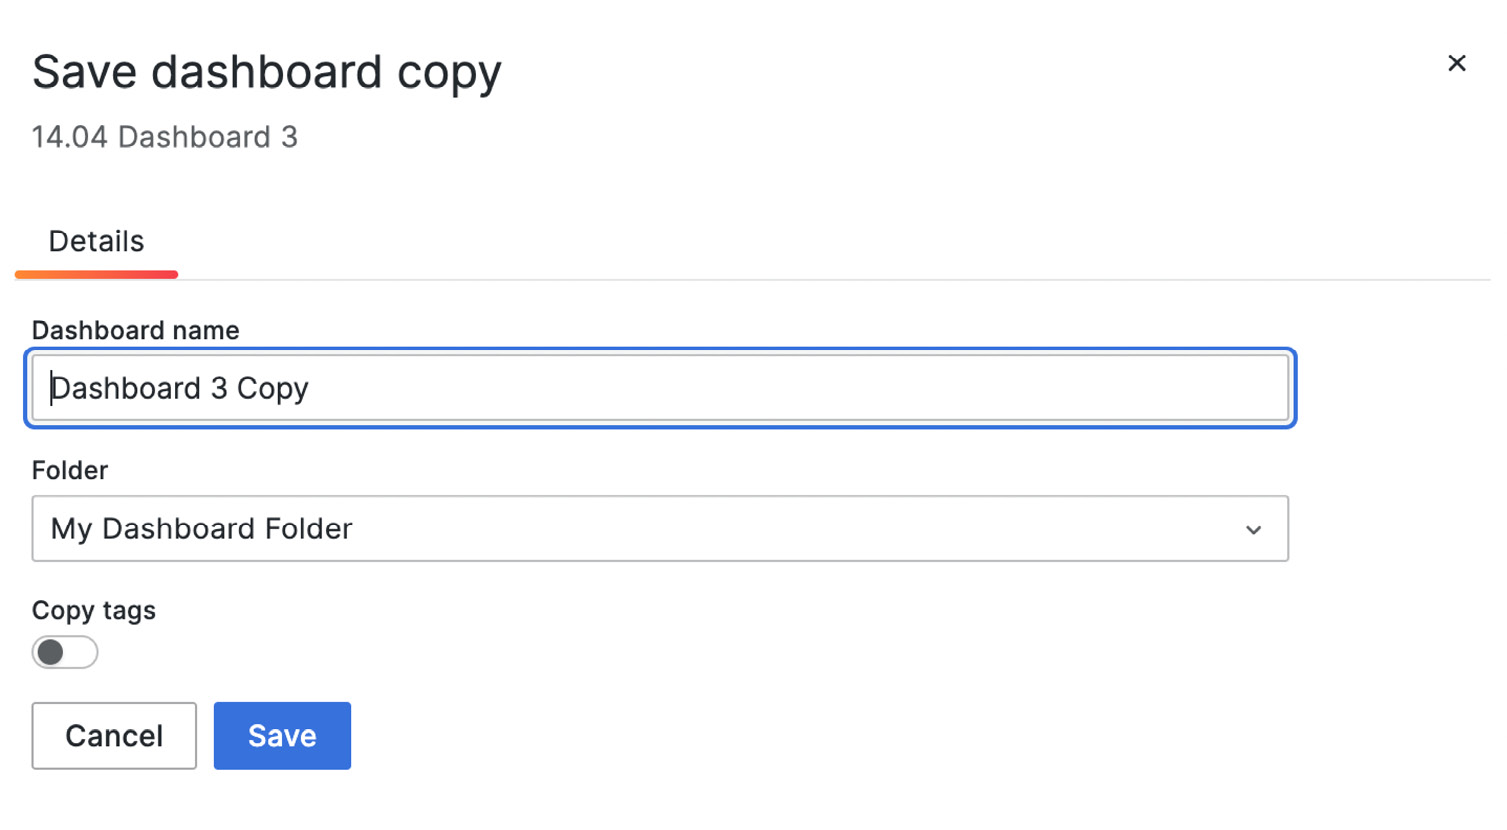
If you just want to create another version of the dashboard for experimentation or to stage prior to putting it into production, use the Save as option at the top of the dashboard Settings page. Remember, you can always roll back changes to an existing dashboard from the Versions page under dashboard Settings.

Here’s how to copy a dashboard to a new name:

  1. Open the dashboard settings.
  2. Instead of clicking Save dashboard, click on Save as. That will bring up a new dialog where you can pick a name for the copy of the dashboard:
  3. Set the name and optionally the folder. Set the tags if you’d like to keep the existing tags.
Figure 14.19 – Copying a dashboard

Figure 14.19 – Copying a dashboard

  1. Click...

Summary

This was a relatively easy introduction to some of the concepts involved in Grafana management. In this chapter, we looked at how to name dashboards and folders, as well as some strategies for creating folders, and looked at starring and tagging dashboards and how they can be useful for grouping and filtering dashboards. Then, we created some dashboard playlists, a common function if you are creating dashboard presentations. We looked at how the Dashboard list panel can be configured to help create catalogs of dashboards, especially by leveraging the search option and tags. Finally, we discussed strategies for duplicating dashboards.

The intention here wasn’t to reveal especially esoteric Grafana concepts – in fact, you may have already been working with some of the features we highlighted in this chapter. The goal was to get you to shift your thinking to a more operational viewpoint, one that often must take into account the potentially competing needs of...

lock icon
The rest of the chapter is locked
You have been reading a chapter from
Learn Grafana 10.x - Second Edition
Published in: Dec 2023Publisher: PacktISBN-13: 9781803231082
Register for a free Packt account to unlock a world of extra content!
A free Packt account unlocks extra newsletters, articles, discounted offers, and much more. Start advancing your knowledge today.
undefined
Unlock this book and the full library FREE for 7 days
Get unlimited access to 7000+ expert-authored eBooks and videos courses covering every tech area you can think of
Renews at $15.99/month. Cancel anytime

Author (1)

author image
Eric Salituro

Eric Salituro is currently a Software Engineering Manger with the Enterprise Data and Analytics Platform team at Zendesk. He has an IT career spanning over 30 years, over 20 of which were in the motion picture industry working as a pipeline technical director and software developer for innovative and creative studios like DreamWorks, Digital Domain, and Pixar. Before moving to Zendesk, he worked at Pixar helping to manage and maintain their production render farm as a Senior Software Developer. Among his accomplishments there was the development of a Python API toolkit for Grafana aimed at streamlining the creation of rendering metrics dashboards
Read more about Eric Salituro