
Microsoft introduced a new debugger from the Microsoft Dynamics NAV 2013 release. The purpose of the revamped debugger is to allow IT people to easily pinpoint the problem any specific user is facing while using the software, for example, with conditional breakpoints, debugging other user sessions, and debugging C/AL code in the Windows client, instead of in incomprehensible C# code. All these new features make the debugging experience a happy one.
The following topics are covered in this chapter:
- The art of debugging
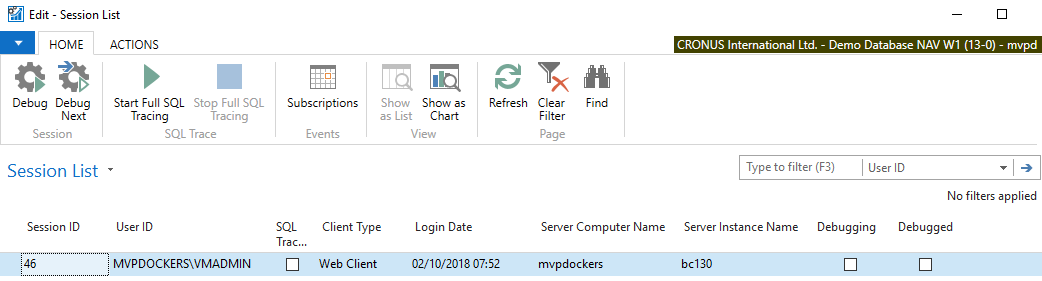
- Starting the debugger
- Placing breakpoints
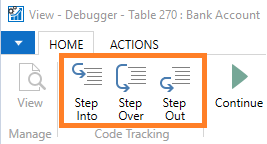
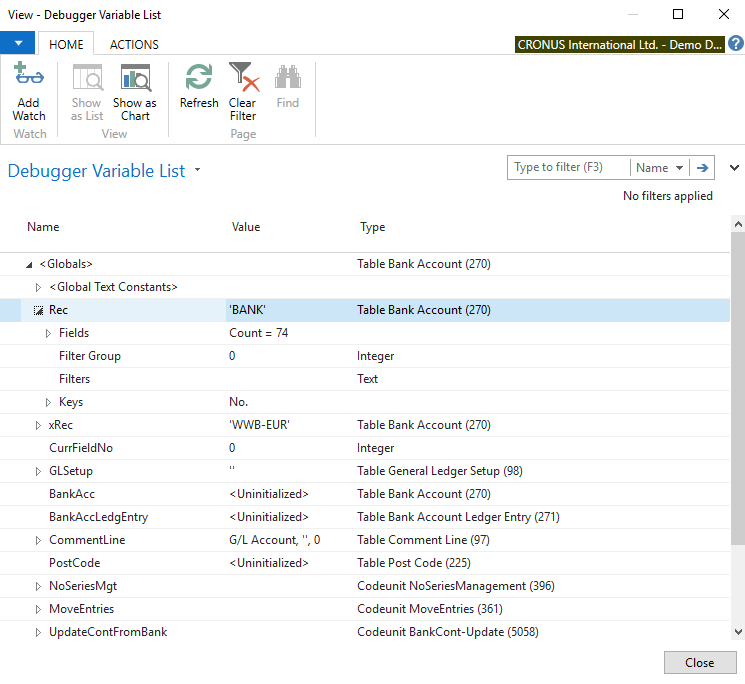
- Line-by-line execution
- How to debug in the new AL Development Environment
Note
On 1st October 2018, Microsoft coined this new name for the New Modern Development Environment, that is, AL Development Environment, in relation to the launch of Microsoft Dynamics 365 Business Central on-premise.