Reader small image

You're reading from  Tableau 10 Business Intelligence Cookbook

Product typeBook
Published inNov 2016
PublisherPackt
ISBN-139781786465634
Edition1st Edition
Tools
Right arrow
Authors (2):
Donabel Santos
Donabel Santos
author image
Donabel Santos

Donabel Santos is a self-confessed data geek. She loves working with data, writing queries, and developing reports on her SQL Server databases, and exploring and visualizing data with Tableau. She is the principal and senior business intelligence architect at QueryWorks Solutions, a Tableau Learning and Alliance partner in Vancouver, BC, Canada, providing consulting and training services. She has spent years in consulting and has developed a variety of solutions for clients in different verticals—finance, manufacturing, healthcare, legal, higher education, and local government. Donabel is a multi-year Microsoft Data Platform MVP (previously known as SQL Server MVP) and has extensive experience in the SQL server in different areas, such as development, administration, data warehouse, reporting (SSRS), tuning, troubleshooting, XML, CLR, and integration with ERPs and CRMs using PowerShell, C#, SSIS, and Power BI. One of Donabel's passions is teaching and sharing her love for data. She is a Tableau Certified Professional and a Tableau accredited trainer, delivering Tableau public and on-site client training. She is also the lead instructor for a number of courses at British Columbia Institute of Technology (BCIT), including Applied Database Administration and Design (ADAD) and Applied Data Analytics (ADA) programs. She teaches SQL server administration, development, integration (SSIS), data warehouse foundations, and visual analytics with Tableau. Donabel has also authored three other books with Packt Publishing: SQL Server 2012 with PowerShell V3 Cookbook, PowerShell for SQL Server Essentials, and SQL Server 2014 with PowerShell V5 Cookbook. She also contributed a chapter to Manning Publications' PowerShell Deep Dives.
Read more about Donabel Santos

Paul Banoub
Paul Banoub
author image
Paul Banoub

Contacted on: 18/12/2015 for Mastering Tableau 10 [video]
Read more about Paul Banoub

View More author details
Right arrow

Adding a trend line


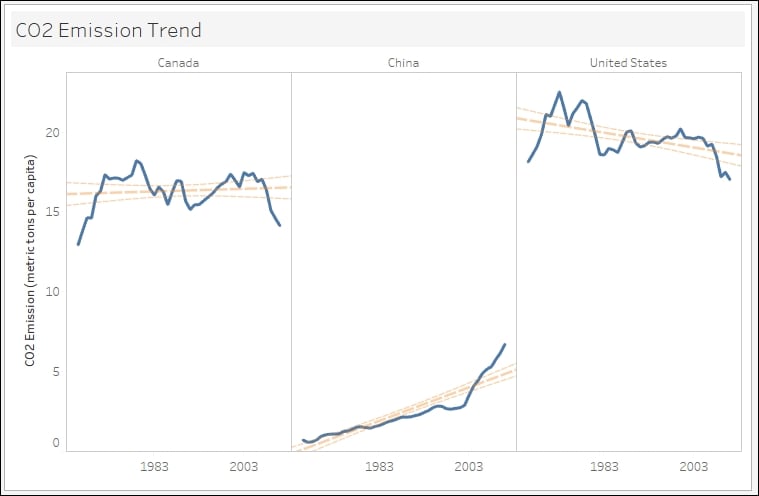
Trend lines are typically added to charts to visualize general patterns or movement. An upward trend suggests the two variables being used on the axes are directly proportional, meaning as one value goes up, the other one tends to go up. A downward trend may suggest an inverse relationship between the variables, meaning as one value goes up, the other one goes down.

In this recipe, we will add trend lines for the CO2 emissions of Canada, China, and United States:

Getting ready

To follow this recipe, open B05527_06 – STARTER.twbx. Use the worksheet called Trend Line, and connect to the CO2 (Worldbank) data source:

How to do it...

Here are the steps to create the CO2 emission trends lines:

  1. From Dimensions, drag Country Name to the Filters shelf.

  2. In the Filters window, choose Canada, China and United States.

  3. From Dimensions, drag Country Name to Columns.

  4. From Dimensions, right-click and drag Year DT to the Columns shelf, to the right of Country Name. Choose continuous month (that...

lock icon
The rest of the page is locked
Previous PageNext Page
You have been reading a chapter from
Tableau 10 Business Intelligence Cookbook
Published in: Nov 2016Publisher: PacktISBN-13: 9781786465634

Authors (2)

author image
Donabel Santos

Donabel Santos is a self-confessed data geek. She loves working with data, writing queries, and developing reports on her SQL Server databases, and exploring and visualizing data with Tableau. She is the principal and senior business intelligence architect at QueryWorks Solutions, a Tableau Learning and Alliance partner in Vancouver, BC, Canada, providing consulting and training services. She has spent years in consulting and has developed a variety of solutions for clients in different verticals—finance, manufacturing, healthcare, legal, higher education, and local government. Donabel is a multi-year Microsoft Data Platform MVP (previously known as SQL Server MVP) and has extensive experience in the SQL server in different areas, such as development, administration, data warehouse, reporting (SSRS), tuning, troubleshooting, XML, CLR, and integration with ERPs and CRMs using PowerShell, C#, SSIS, and Power BI. One of Donabel's passions is teaching and sharing her love for data. She is a Tableau Certified Professional and a Tableau accredited trainer, delivering Tableau public and on-site client training. She is also the lead instructor for a number of courses at British Columbia Institute of Technology (BCIT), including Applied Database Administration and Design (ADAD) and Applied Data Analytics (ADA) programs. She teaches SQL server administration, development, integration (SSIS), data warehouse foundations, and visual analytics with Tableau. Donabel has also authored three other books with Packt Publishing: SQL Server 2012 with PowerShell V3 Cookbook, PowerShell for SQL Server Essentials, and SQL Server 2014 with PowerShell V5 Cookbook. She also contributed a chapter to Manning Publications' PowerShell Deep Dives.
Read more about Donabel Santos

author image
Paul Banoub

Contacted on: 18/12/2015 for Mastering Tableau 10 [video]
Read more about Paul Banoub