Reader small image

You're reading from  Tableau 10 Business Intelligence Cookbook

Product typeBook
Published inNov 2016
PublisherPackt
ISBN-139781786465634
Edition1st Edition
Tools
Right arrow
Authors (2):
Donabel Santos
Donabel Santos
author image
Donabel Santos

Donabel Santos is a self-confessed data geek. She loves working with data, writing queries, and developing reports on her SQL Server databases, and exploring and visualizing data with Tableau. She is the principal and senior business intelligence architect at QueryWorks Solutions, a Tableau Learning and Alliance partner in Vancouver, BC, Canada, providing consulting and training services. She has spent years in consulting and has developed a variety of solutions for clients in different verticals—finance, manufacturing, healthcare, legal, higher education, and local government. Donabel is a multi-year Microsoft Data Platform MVP (previously known as SQL Server MVP) and has extensive experience in the SQL server in different areas, such as development, administration, data warehouse, reporting (SSRS), tuning, troubleshooting, XML, CLR, and integration with ERPs and CRMs using PowerShell, C#, SSIS, and Power BI. One of Donabel's passions is teaching and sharing her love for data. She is a Tableau Certified Professional and a Tableau accredited trainer, delivering Tableau public and on-site client training. She is also the lead instructor for a number of courses at British Columbia Institute of Technology (BCIT), including Applied Database Administration and Design (ADAD) and Applied Data Analytics (ADA) programs. She teaches SQL server administration, development, integration (SSIS), data warehouse foundations, and visual analytics with Tableau. Donabel has also authored three other books with Packt Publishing: SQL Server 2012 with PowerShell V3 Cookbook, PowerShell for SQL Server Essentials, and SQL Server 2014 with PowerShell V5 Cookbook. She also contributed a chapter to Manning Publications' PowerShell Deep Dives.
Read more about Donabel Santos

Paul Banoub
Paul Banoub
author image
Paul Banoub

Contacted on: 18/12/2015 for Mastering Tableau 10 [video]
Read more about Paul Banoub

View More author details
Right arrow

Creating a motion chart


In this recipe, we will create an animated chart that shows how population has changed over the years for a few selected countries.

Getting ready

To follow this recipe, open B05527_03 - STARTER.twbx. Use the worksheet called Motion Chart, and connect to the CO2 (Worldbank) data source.

How to do it…

The following are the steps to create a motion chart:

  1. From Dimensions, drag Year to the Columns shelf.

  2. From Measures, drag CO2 Emission to the Rows shelf.

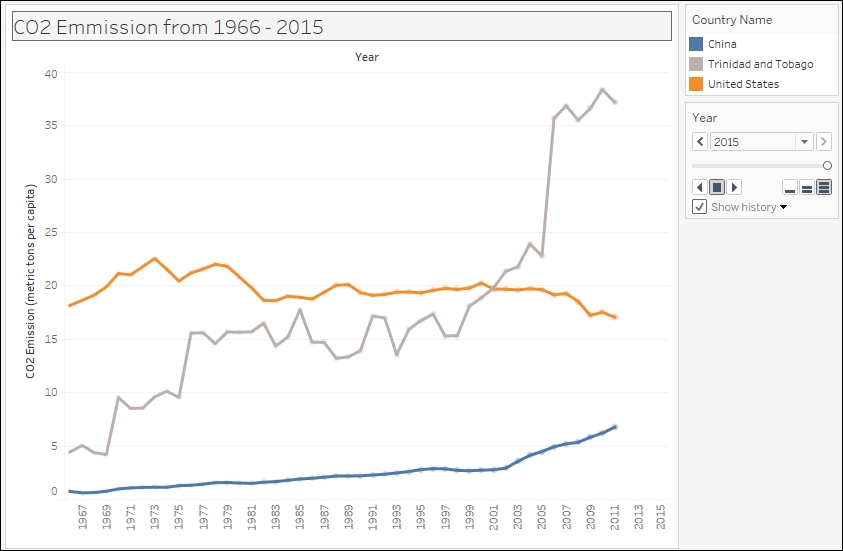
  3. Right-click on the CO2 Emission axis, and change the title to CO2 Emission (metric tons per capita).

  4. In the Marks card, click on the dropdown to change the mark from Automatic to Circle.

  5. From Dimensions, drag Country Name to Color in the Marks card.

  6. From Dimensions, drag Country Name to the Filter shelf.

  7. Under the General tab of the Filter window, while the Select from list radio button is selected, select None.

  8. Select the Custom value list radio button, still under the General tab, and add China, Trinidad and Tobago, and United...

lock icon
The rest of the page is locked
Previous PageNext Page
You have been reading a chapter from
Tableau 10 Business Intelligence Cookbook
Published in: Nov 2016Publisher: PacktISBN-13: 9781786465634

Authors (2)

author image
Donabel Santos

Donabel Santos is a self-confessed data geek. She loves working with data, writing queries, and developing reports on her SQL Server databases, and exploring and visualizing data with Tableau. She is the principal and senior business intelligence architect at QueryWorks Solutions, a Tableau Learning and Alliance partner in Vancouver, BC, Canada, providing consulting and training services. She has spent years in consulting and has developed a variety of solutions for clients in different verticals—finance, manufacturing, healthcare, legal, higher education, and local government. Donabel is a multi-year Microsoft Data Platform MVP (previously known as SQL Server MVP) and has extensive experience in the SQL server in different areas, such as development, administration, data warehouse, reporting (SSRS), tuning, troubleshooting, XML, CLR, and integration with ERPs and CRMs using PowerShell, C#, SSIS, and Power BI. One of Donabel's passions is teaching and sharing her love for data. She is a Tableau Certified Professional and a Tableau accredited trainer, delivering Tableau public and on-site client training. She is also the lead instructor for a number of courses at British Columbia Institute of Technology (BCIT), including Applied Database Administration and Design (ADAD) and Applied Data Analytics (ADA) programs. She teaches SQL server administration, development, integration (SSIS), data warehouse foundations, and visual analytics with Tableau. Donabel has also authored three other books with Packt Publishing: SQL Server 2012 with PowerShell V3 Cookbook, PowerShell for SQL Server Essentials, and SQL Server 2014 with PowerShell V5 Cookbook. She also contributed a chapter to Manning Publications' PowerShell Deep Dives.
Read more about Donabel Santos

author image
Paul Banoub

Contacted on: 18/12/2015 for Mastering Tableau 10 [video]
Read more about Paul Banoub