

Often when we analyze or visualize data, we find ourselves needing additional fields, which are not available in the data source. Not to worry! Most of the time, we can derive these fields using some logic within the Tableau scripting language. We can choose to create ad hoc calculations and even save them back in our Tableau data source or workbook so we can reuse them for multiple worksheets.

There are different ways to create calculated fields in Tableau, as follows:
From the drop-down arrow beside the Dimensions section in the side bar:

From the field you want to use in the calculated field:


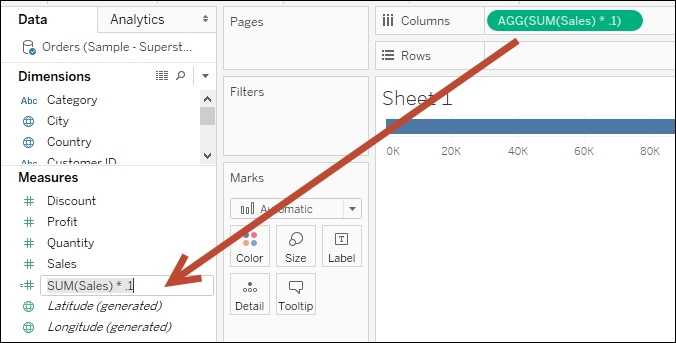
From the Rows or Columns shelf by double-clicking on an empty space. This is called ad hoc calculation:

From the Marks card by double-clicking on an empty space. This is also called an ad hoc calculated field:

If you create an adhoc calculation, this piece of information can only be used within the worksheet you created it in. This is not viewable in other worksheets in the same workbook. If you need to persist this field, you can simply drag the pill that contains the ad hoc calculation to anywhere in the side bar. You can rename this field once you see it in the side bar. Once the field is saved, you can use this anywhere in the workbook, just like any other calculated fields. This is shown in the following screenshot:
Starting with Tableau V9, the calculated field window shows up a white, modeless window. Prior to Tableau V9, you needed to close the calculated field window before you could do anything else with Tableau. With the modeless window, you can continue to work on your tasks, such as dragging fields to shelves, while the calculated field editor is open. The modeless window also allows you to drag and drop fields from the sidebar onto the calculated field window.
In the calculated field window, you have to specify the calculated field name and an expression (or formula).This expression can include the following:
Data fields from your data source(s)
Functions
Parameters
Comments
Comments are optional but highly recommended. Tableau supports single line comments. Anything that starts with two forward slashes, //, will be considered a single line comment and will not be executed by Tableau, as shown next:
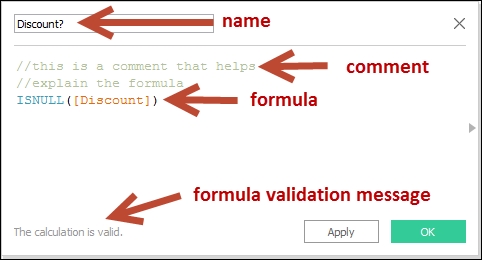
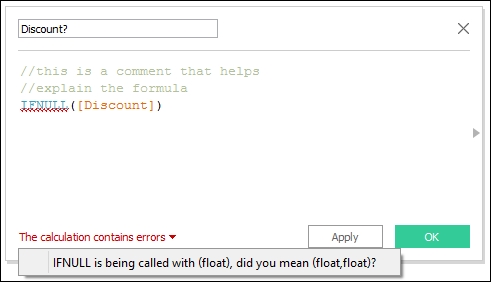
If there are any errors, there will be a message at the bottom of the editor that will show the error message. The formula itself will have a red squiggly underline to signal the error in the syntax. This is shown in the following screenshot:
Often, when we need to derive data, we may need to incorporate some built-in functions in Tableau. Functions are reusable, "callable" code that can be used in calculations. Functions also return some kind of value.
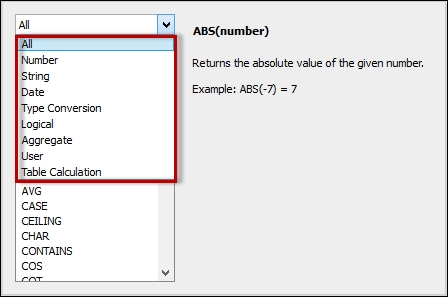
In the calculated field editor, there is a faint arrow on the right side of the rectangle. When you click on this, it will expand and show a Help box for functions that are supported in Tableau:
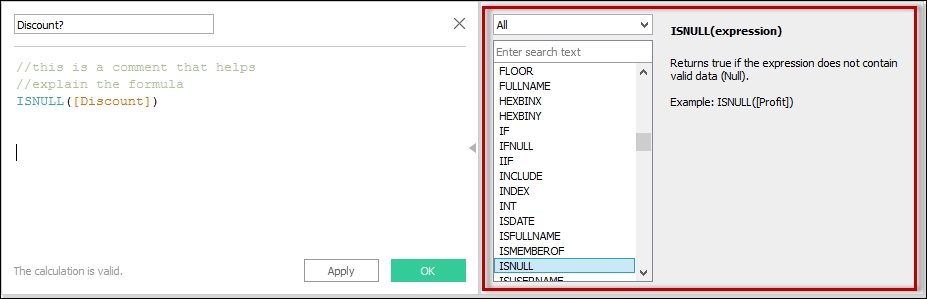
When you click on the dropdown of the help window, you will see a list of the function categories available:
It is very helpful to click through the list of functions even just to see what the syntax is and to see some examples.
In general, functions have to be used with parentheses. The items inside parentheses are the values that the function expects when you use them. These are called arguments.

If the syntax for a specific function shows an argument enclosed in square brackets, it means that that specific argument is optional, that is, it is not a syntax error if you do not have to pass the value for it.
Note
A list of Tableau functions can be found at: http://bit.ly/tableau_fxns
In the following screenshot, you can see the function syntax for DATEDIFF. The first argument, date_part, is a common value you will need to supply for a number of date-related functions:
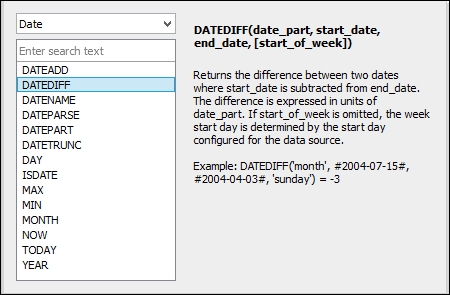
As the DATEDIFF example illustrates in the aforementioned screenshot, if a constant date needs to be used, they need to be enclosed in # (hash or pound) signs.
The Tableau website lists the date_part values. You can also access them from http://bit.ly/date_part.
Although some of the functions supported in Tableau have the same name as the functions you use in other applications or languages (SQL, for example), I caution you against assuming that it works the same way. There are functions that have the same name but will require different arguments, or return a different type, or both.
One example is the ISNULL function. In Tableau, the syntax of ISNULL is as follows:
ISNULL(expression)
This function in Tableau accepts a single argument and returns a Boolean value.
Transact-SQL (or T-SQL) has a similar function. However, the syntax in T-SQL is as follows:
ISNULL(check_expression, replacement_value)
In T-SQL, this function accepts two arguments and replaces the expression value if it is null. The return type is not a Boolean value. The function returns the same return type as the check_expression argument.
Support for regular expressions was introduced in Tableau V9. Regular expressions allow searching through patterns. This is quite powerful because sometimes the information is embedded in text, and it would be hard to search or extract otherwise.
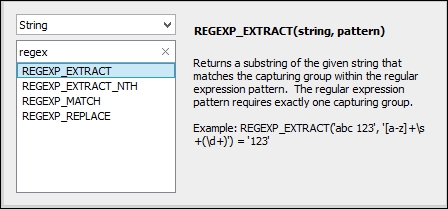
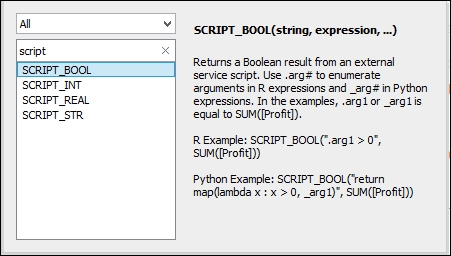
Tableau also supports R expressions within Tableau calculated fields. The following is a list of functions that accept R expressions:
There are different types of calculated fields. They differ in function and behavior. They also differ in where they are executed and in what order.
Let us look some different levels in the fields:
Simple calculated fields are fields that include expressions and/or formulas and are typically handled by the data source.
Row-level calculated fields are fields that can be calculated at the row level or the most granular level. For example, look at the following formula for concatenating a series of strings—first name, a space, and a last name:
FirstName + " " + LastName
The preceding code can derive the full name using only the information within the row itself. It does not need to refer to the result of a group first before it can concatenate the first and last names.
An aggregated calculated field involves some calculation after some records are grouped. For example, the expression below checks the total profits of a group:
SUM(Profit) > 0
The term group seems somewhat vague. However, in Tableau, the group is determined by all other discrete fields present in the view.
In the aforementioned expression, a single record is not sufficient to determine the total profit of the group. All the individual records for the group must be processed to come up with a collective profit amount.
There is a distinct difference between row-level calculations and aggregations. Row-level calculations are processed first since they occur for each record. Aggregations happen after the row-level calculations are processed.
To illustrate, have a look at the following comparison:
|
Operation |
Formula 1 |
Formula 2 |
|---|---|---|
|
|
| |
|
1 |
Each record gets a ratio |
All of the profits will be summed up, and all sales will be summed up |
|
2 |
Total of profit will be divided by total of sales | |
|
When dragged to the view |
Will be aggregated Default aggregation is This will produce an incorrect ratio for the group |
Will not be aggregated, since the aggregation is already embedded in the formula Will show as This will produce a correct ratio for the group |
Table calculations, as the name implies, are calculations that happen at the table. Unlike regular calculations, table calculations do not happen at the data source. These happen in Tableau locally and are calculated based on what is in the view and how the data is laid out.
When I present the concept of table calculations in my training sessions, I usually start by asking students for a random number. Let's say they gave me the following numbers:
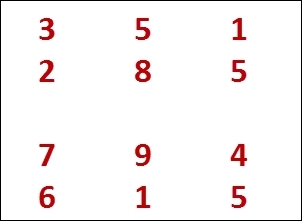
If we were trying to get the running total of the numbers, and we start with the top left number, what will be our first result? That's easy, it's 3.
But what if I asked you what the next number is? It's not so straightforward, is it? The following points will help answer the question:
Which direction is next? Should you go across and add 5, or go down and add 2?

What happens when we get to the next group? Do we keep going? Or do we start again?

This is the pivotal moment of the discussion. Students start to really understand how table calculations work at this point, and it makes it clear that table calculations are affected by the following factors:
What is in the view and what is filtered out of the view. If we were to take all the 5s out, the running total numbers would change.
How the data is laid out. If we were to swap the rows and columns or move the columns around, the running total numbers would be different.
You can add table calculations from a continuous (green) pill on your view. When you click on the dropdown, you can find some predefined Quick Table Calculations:
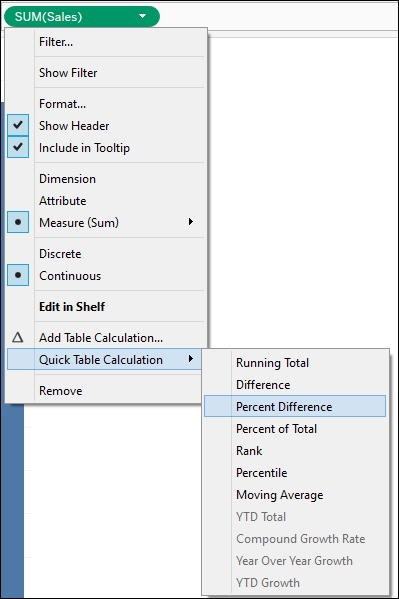
If the fields required to do the quick table calculation are not present, some of the options will be disabled. In the aforementioned case, if date fields are missing, any YTD (year to date) or YOY (year over year) calculations will be grayed out.
You can also create a customized table right off the bat by selecting the Add Table Calculations… option. Here is the window that appears when you click on Add Table Calculations..., which looks different from the Tableau V10 version. The window is modeless starting in V10, meaning you don't have to close the window to work on your view. You can still work on your view with this window open:
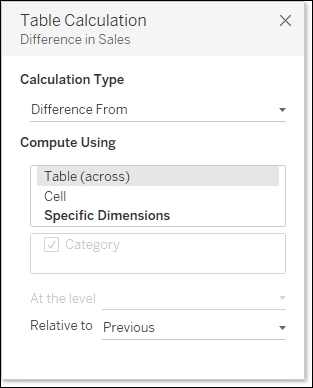
Some table calculations also allow for secondary table calculations, such as Running Total. Once you select the option for Secondary Table Calculation, a second window opens with additional options:

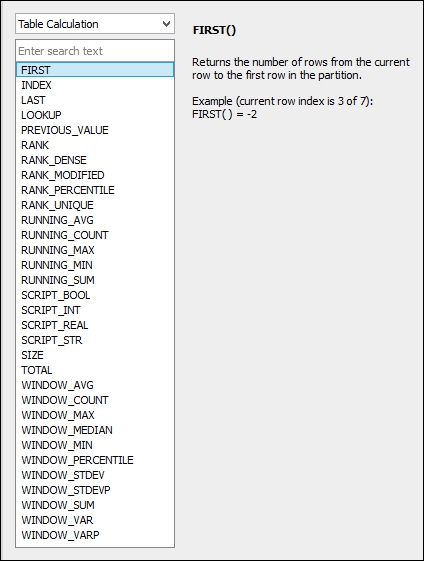
You can also use table calculation functions in your formulas. If you open the help window in the calculated field editor and choose Table Calculation from the dropdown, you will see a list of table calculation functions supported in Tableau, as shown in the following screenshot:
Granularity or level of detail in Tableau, by default, is based on the discrete values you have in your view. Each discrete value is a by or per value—a slicer for the measures in the view.
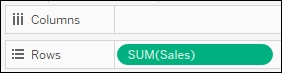
For example, here we are getting the overall sum:
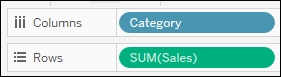
Once we add another discrete value, for example Category, to the Columns shelf, we are breaking the SUM(Sales) value down to a subtotal for each Category:
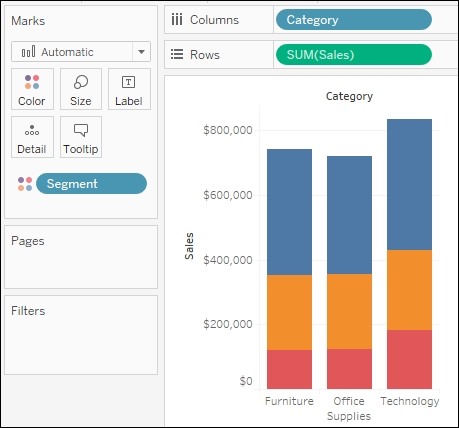
When we add one more discrete pill to the other Marks cards, the number is further broken down. In the following example, each bar color represents the SUM(Sales) for that Category and Segment:
But what if we wanted to have different levels of aggregation in one view, such as show a grand total but also the average per customer? A grand total will be more aggregated, and an average per customer will be less aggregated. Level of detail (LOD) expressions allow us to combine different aggregation levels in the same view.
The main syntax of an LOD expression is as follows:
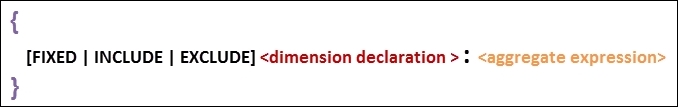
LOD expressions produce a separate call to the data source and produce a row-level value as far as Tableau is concerned.
Tableau V10 now allows expressions to be used instead of dimension field names. In previous versions, if you needed to derive a dimension based on some logic, you needed to create a new field first and then use it in the LOD expression. In Tableau V10, this step can be eliminated by embedding another expression in place of the dimension name. For example, if you want to fix average sales per the company code, and the company code is the second substring in the Company field, you can simply use the corresponding expression that splits the company code in the LOD expression:
{FIXED TRIM(SPLIT([Company], "-", 2)): AVG(Sales)}There are three types of LOD expression: FIXED, INCLUDE, and EXCLUDE.
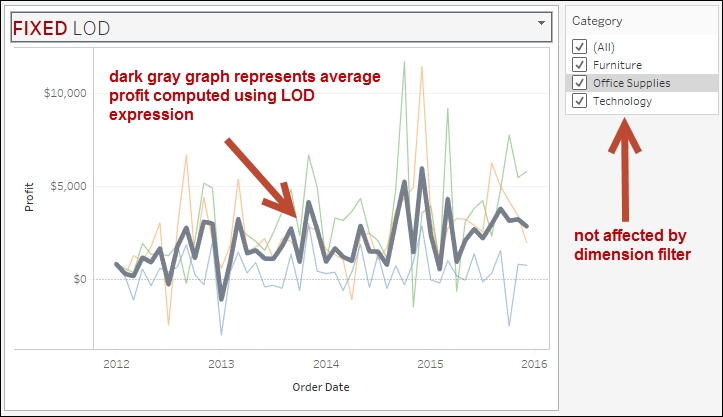
A FIXED LOD expression only considers the dimensions or expressions in the dimension declaration in its calculation. It is a fairly static calculation, which is not affected by what is dragged to or off the view. FIXED LOD expressions are not affected by dimension filters, but they respect data source and context filters.
In the following example, the profit values for each of the categories are plotted in individual line graphs. There is also a big, thick line graph that represents the average of the categories. This average is calculated using some FIXED LOD expressions. This means that the average value will not change even if some of the categories are unchecked from the filter. This is shown in the following screenshot:
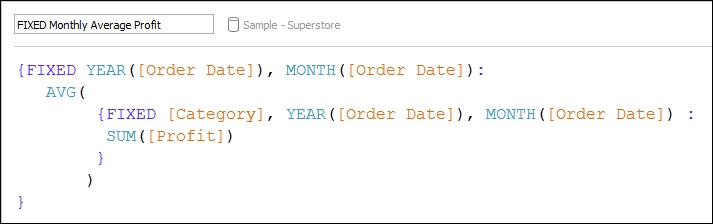
The formula for the average fixes the sum of profit for category, year, and month first. This is then passed to an outer expression, which then calculates the average of the sums based on a time period (year and month):
An INCLUDE LOD expression computes values as if the fields in the dimension declaration have been dragged onto the view. INCLUDE LODs are affected by dimension filters.
INCLUDE LODs will be used when you want a lower level of detail aggregation in the view.
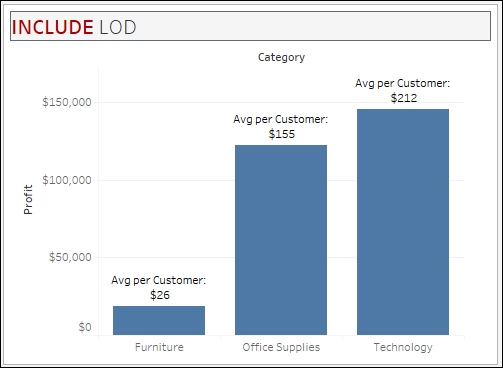
In the following graph, although the view shows only the sum of profit for each category, a finer level of aggregation is introduced, which is the average per customer. This is done using an INCLUDE LOD expression, as shown next:
The formula for the Avg per Customer calculation is as follows:
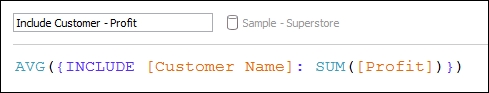
This means that the calculation will create an aggregation based on all the dimensions in the view and the Customer Name, as if the Customer Name was dragged onto the view.
An EXCLUDE LOD expression computes values as if the fields in the dimension declaration have been removed from the view. EXCLUDE LODs are affected by dimension filters.
EXCLUDE LODs will be used when you want a higher level of detail aggregation in the view:
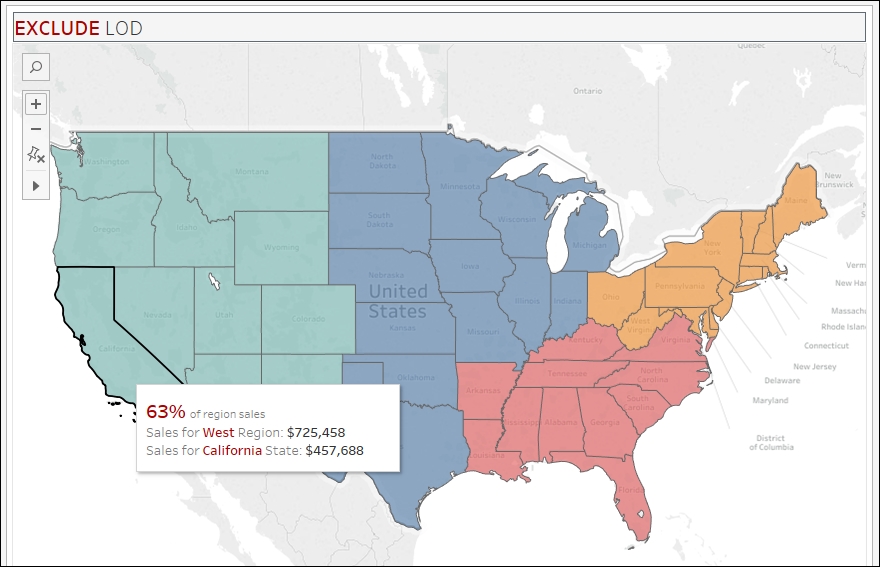
The formula for the Exclude State for Region Sales field is as follows:
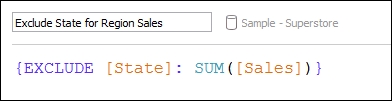
In the aforementioned example, the view presents a level of detail at the State level represented by the map, but the tooltip shows one aggregation by State and another by Region regardless of State.
By default, if we drag Sales onto the view, it will be SUM(Sales) per Region per State. However, if we want to display both SUM(Sales) per State (less aggregated) and SUM(Sales) per Region (more aggregated), we can use the EXCLUDE LOD expression to ignore the State field when calculating SUM(Sales) per Region.
Level of detail (LOD) expressions formed one of the most anticipated features introduced in Tableau v9. LODs add immense flexibility to Tableau and simplify how complex calculations were done in the past versions.
Some of the most common use cases where LODs can be used are listed in Bethany Lyons' article on Top 15 LOD expressions, which can be found at http://bit.ly/top15LOD. A few use cases are as follows:
Cohort analysis: Depending on the situation, we may need to keep or fix specific data points in order to perform group analysis. For example, we may need to know when customers first ordered, first joined a program, first got paid and so on, and from there perform additional aggregations.
Aggregating an aggregate: LODs can be used to calculate the aggregate of aggregates. For example, we may need to know the average of maximum or minimum values and make the calculation immune to dimension filters.
Comparing to others: LODs can be used to compare one data point to others. For example, to compare one vendor to other vendors, or one customer to other vendors, we may be required to have certain fields fixed to that customer or vendor. LOD calcs can help with this.
Relative period filtering: LOD expressions allow us to find the maximum date in a data set to facilitate performance analysis through relative filtering, for example if we want to compare YTD values of this year with last year's.
Proportional brushing: LOD expressions facilitate proportional brushing. This is a technique that allows us to compare one value to another without filtering the "other" values while showing the two values together, relative to the whole.
Despite being quite powerful and flexible, LODs have limitations, and we need to be aware of them. The limitations are listed at http://bit.ly/lod-overview, and include the following:
It is important to understand the order of operations in Tableau, especially with the filters. For example, do dimension filters affect LOD expressions? If this is not understood, there will be some unexpected behaviors.
The following is Tableau's updated illustration for order of operations (as of August 2016), as shown in the Tableau official online documentation:
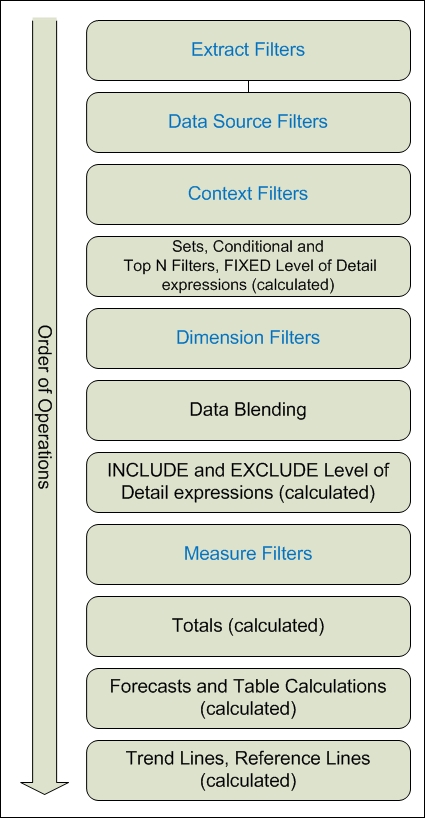
Source – Tableau online documentation
You can find the original at http://bit.ly/tableau-orderofoperations.
What this section has covered is barely the tip of the iceberg, and I encourage you to learn more about calculations in depth. Understanding the types of calculations and when they are appropriate to use can make you really efficient and effective in Tableu.
Note
Here is a great article by Alan Aldridge on choosing the right calculation type:
https://blog.databender.net/2016/03/06/choosing-the-right-calculation-type/
When working with calculated fields, it is important to understand what NULLs are and how to deal with fields that have NULL values.
A NULL is a missing value. It is an indeterminate value. A NULL is not:
a zero
a space
an empty string
Whenever there is an operation between a field that has a value and a field that has a NULL, the result is always a NULL. When you add 1 to nothing, what is the result? Indeterminate. When you concatenate a first name to an unknown value, what is the result? Indeterminate—we don't know.
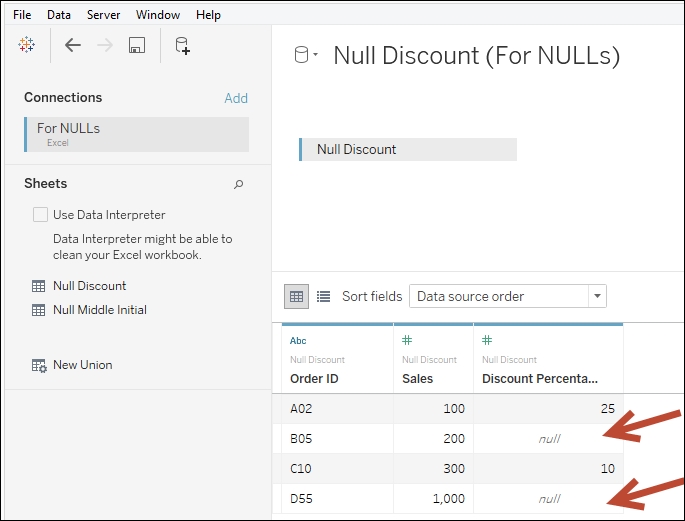
Let's take the following data set:
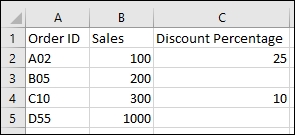
Once you connect this Excel file to Tableau, the initial connection screen will look like the following. Notice how the missing values in Excel appear as NULL in the preview screen:
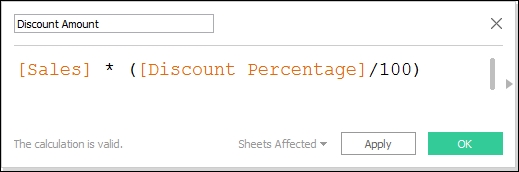
The following formula will calculate the discount amount correctly if there are no NULL values:
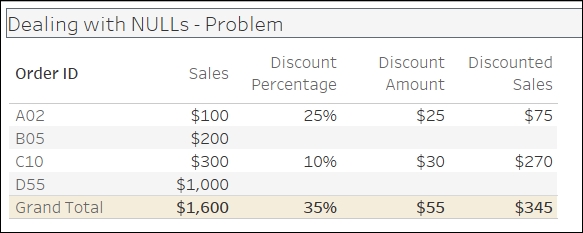
If we try to calculate the total discounted price as normal, using the following formula, we are going to get incorrect results:
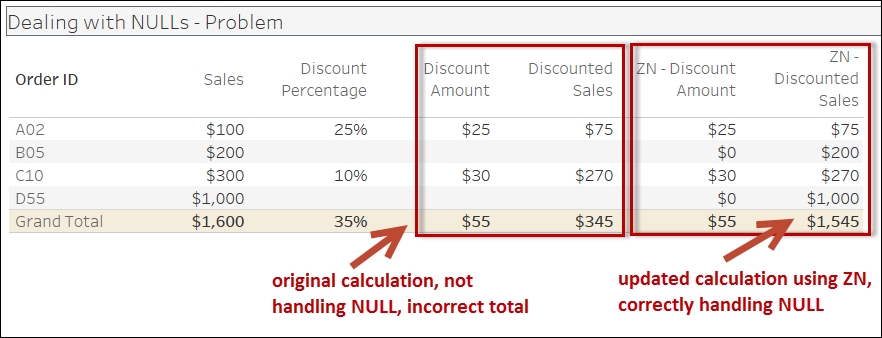
Here are a few ways to deal with NULL values:


Each of these calculations will produce a 0 for the discount amount if the discount percentage is missing. This will allow the discounted sales amount, that is, sales less discount amount, to be calculated correctly:
Here are a few tidbits/tricks that you may find helpful as you venture into the world of calculated fields in Tableau (Conversion error):
One of the most common calculation errors you may encounter will be related to mixing aggregate and non-aggregate arguments in functions:
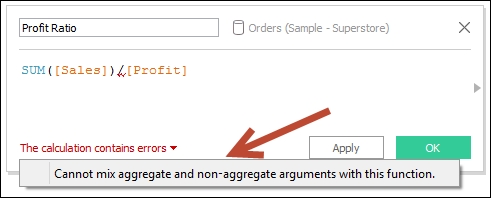
What this simply states is that if one part of the calculation is an aggregation (such as SUM, AVG, MAX, and MIN), all other parts should also be aggregations.
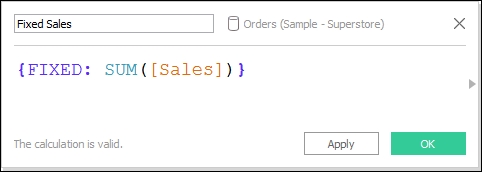
This becomes tricky when working with level of detail calculations. For example, we may have an LOD expression that gets a FIXED sum of sales:
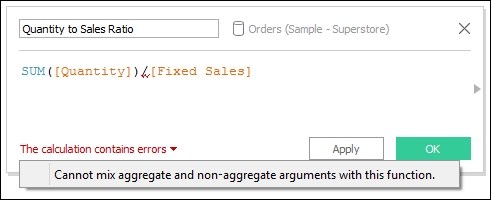
What if we need to use this with another calculated field that is aggregated? In the following example, we are dividing SUM(Quantity) by our fixed LOD calculated field, which is already an aggregated field. However, we are getting the notorious Cannot mix aggregate and non-aggregate… error, as shown in the following screenshot:
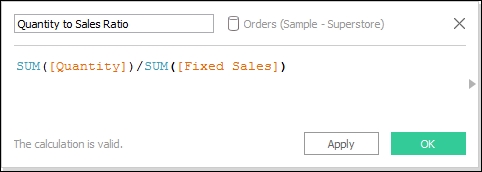
Not to worry. Since LOD expressions are technically treated as row-level values, all we need to do is enclose this field in another aggregation. Putting Fixed Sales in a SUM or MIN or MAX or AVG will not change its value; the SUM of one value is still the same value, but it will help get around the aggregation error:
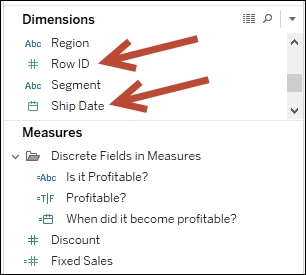
When you first open the sample Superstore Excel file that comes with Tableau, you may have noticed that by default, all the blue (discrete) fields are in the Dimensions section, and the green (continuous) fields are in the Measures section. However, do not assume that only discrete fields can be in Dimensions and continuous fields in Measures.
Numeric and date fields can be converted into Continuous and can still appear in the Dimensions section:
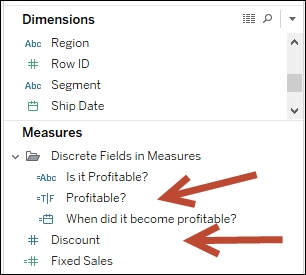
By the same token, measures can be converted to discrete, but they still stay in the Measures section.
Calculated fields that include any aggregation will always appear in the Measures section regardless of the data type. In the following screenshot, you will see different discrete data types in the Measures section as a result of using aggregate functions (such as SUM(Profit)) in the underlying formula:
In Tableau, it is possible to aggregate dimensions too. MIN and MAX are aggregation functions, which can be applied to dimensions. Tableau also has a function called ATTR, which does allow dimension aggregation.
ATTR checks for heterogeneity of values. The ATTR function returns a value if all of that group's values are the same. Otherwise, an asterisk (*) is returned. If we were to convert it to another formula, the ATTR function would be similar to the following expression:
IF MIN(dimension) = MAX(dimension)
THEN "dimension"
ELSE "*"
END
To illustrate, have a look at the following example:
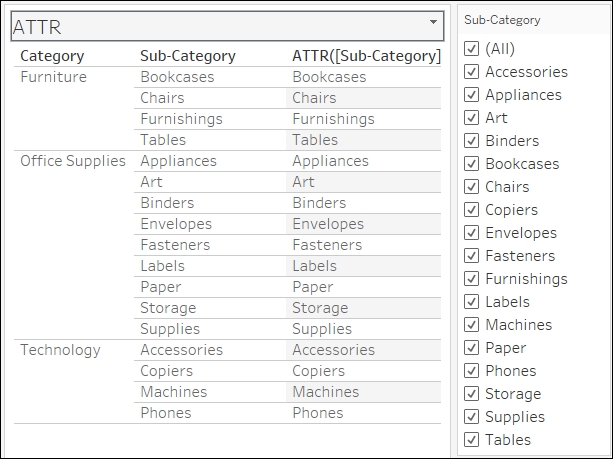
The ATTR([Sub-Category]) field was calculated using the formula ATTR([Sub-Category]). At this point, all the Sub-Category values in every line are uniform; therefore, the ATTR function returns and displays that single value.
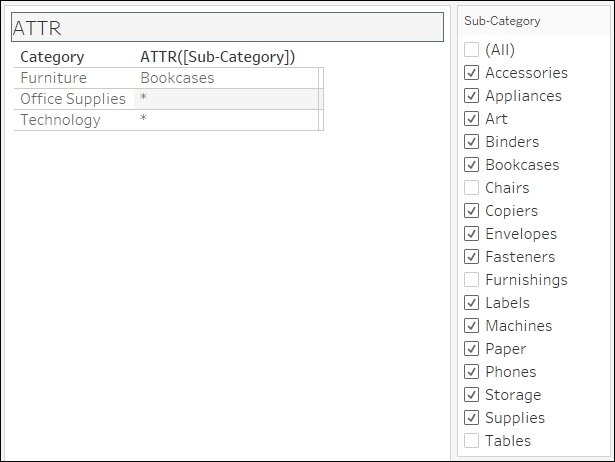
However, once we take the Sub-Category field away and aggregate the dimensions to Category, ATTR([Sub-Category]) should have multiple values and therefore report an asterisk.
In the following screenshot, Bookcases appear only because all the other values in the Furniture group—Chairs, Furnishings, and Tables—have been deselected from the Filter shelf, leaving Bookcases as the only value under that group:
You may see ATTR used a lot when you have blended data. Fields from the secondary data source need to be aggregated, and this is a way to ensure that the returned values from the secondary data source come back as a single label. You may have noticed it before that when you drag dimension fields that produce multiple values, values are displayed as asterisks instead.
Another possible use case is when we want to check whether something or someone has been consistent in behavior. For example, if I want to quickly check whether a students has taken only courses from the Computer Science department, I can use the ATTR() function on Department. All students who have taken only Computer Science courses should reveal Computer Science, while students who have taken from other departments will yield an asterisk (*).
In this section, we covered different ways to create calculated fields in Tableau as well as different types of calculated fields: basic, table calculations, and level of detail calculations. Our data sources will not have all the possible fields we want to use in our analysis. Calculated fields allow us to derive values based on logic and expressions; they ultimately add more flexibility and drive more insights into our Tableau dashboards.
The rest of the chapter is locked
You have been reading a chapter from
Tableau 10 Business Intelligence CookbookPublished in: Nov 2016Publisher: PacktISBN-13: 9781786465634
Register for a free Packt account to unlock a world of extra content!
A free Packt account unlocks extra newsletters, articles, discounted offers, and much more. Start advancing your knowledge today.
undefined
Unlock this book and the full library FREE for 7 days
Get unlimited access to 7000+ expert-authored eBooks and videos courses covering every tech area you can think of
Renews at $15.99/month. Cancel anytime