
A scatter plot is technically a collection of scattered points. Scatter plots require measures (numeric values) on both the vertical and horizontal axes. Scatter plots allow us to see the relationship between two variables, and are great for visualizing clusters, showing possible correlations, and spotting outliers.
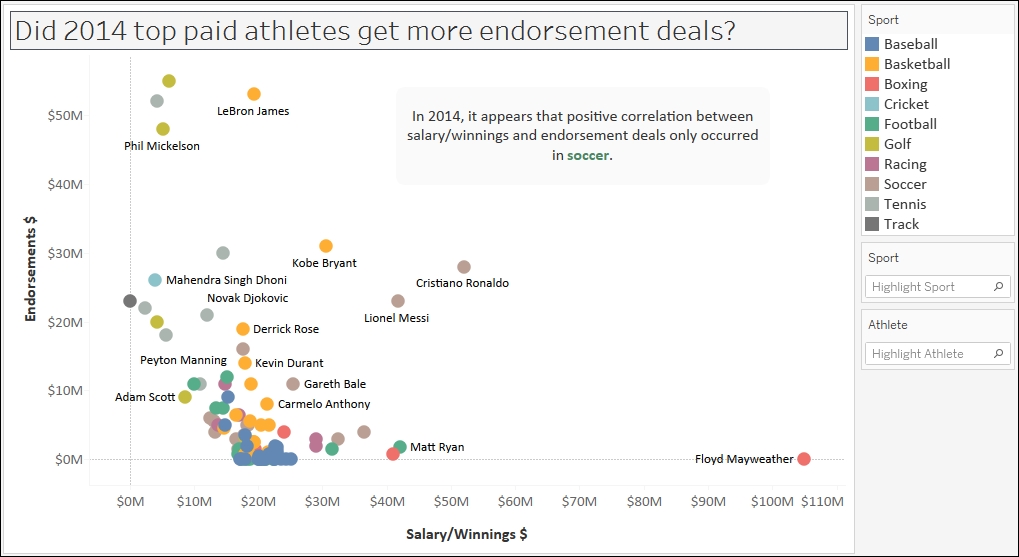
In this recipe, we will use a data source that compiled the highest-paid players in 2014. We will create a scatter plot to see whether there is a general correlation between the earnings of a top player, and the value of their endorsement deals.
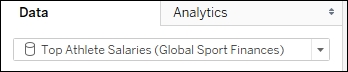
To follow this recipe, open B05527_01 – STARTER.twbx. Use the worksheet called Scatter Plot, and connect to the Top Athlete Salaries (Global Sport Finances) data source.
The following are the steps to create the scatter plot presented in this recipe:
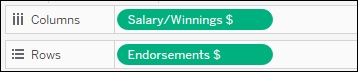
From Measures, drag Salary/Winnings $ to Columns.
From Measures, drag Endorsements $ to Rows.
Change Mark to Circle.

From Dimensions, drag Sport to Color in the Marks card.
From Dimensions, drag Athlete to Label in the Marks card.
Change the default number format of Endorsements $. You can do this by right-clicking the Endorsements $ field in the Measures section of the side bar, selecting Default properties and then Number Format…. In the window that shows up, set the following:
Currency (Custom)
Decimal places:
0Prefix $
Suffix M

Click on the drop-down arrow beside the color legend and choose Edit colors….
Choose the Superfishel Stone palette and click on Assign Palette. Click on OK when done.
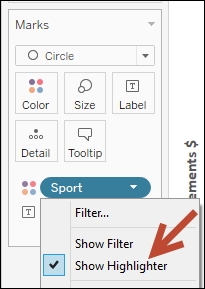
Right-click on the Sport pill in the Marks card, and select Show highlighter. This will show the data highlighter control, a new feature in Tableau 10 that allows you to search and highlight all points on hover.

Right-click on an empty area in your chart and select Annotate, and then Area.
Add the following text in your area annotation:

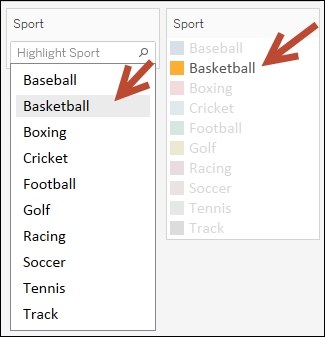
Test the data highlighter. Hover each of the options and notice that as you hover over a sports name, only the players (represented by circles) who belong to that sport are highlighted. Note that in this data set, it seems only soccer has a positive correlation between Salary/Winnings $ and Endorsements $.

Scatter plots are great for determining clusters, correlations, and outliers. Scatter plots require a continuous field in Rows (which produces the vertical or Y axis) and another continuous field in Columns (which produces the horizontal or X axis).
Note
Discrete and continuous fields are discussed in more detail in Appendix C, Working with Tableau 10.
When you first plot the continuous measure fields in the Rows and Columns, you will see a single mark on your canvas.
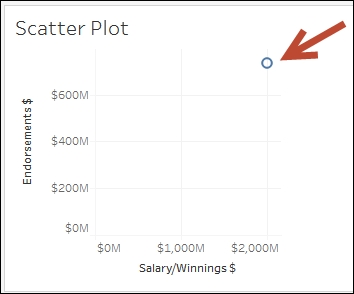
You may be scratching your head and thinking this is not a scatter plot. You are correct, it is not, because it is missing the scatter. However, at this point, Tableau is simply following your instructions, which is to display the aggregate of one measure in Rows and the aggregate of another measure in Columns. In our recipe, it is the SUM(Salary/Winnings $) and the SUM(Endorsement $). This is really just an X and Y coordinate.
To create the scatter plot, this one point needs to be scattered. This can be done by adding dimensions in the Marks card that can force the scatter. For example, adding the Player field to Detail in the Marks card will make Tableau represent one mark per player, and each mark is the SUM(Salary/Winnings $) and SUM(Endorsements $) for that player.
If you want each record from the data source to be presented as a mark in your graph, you can drag the unique identifier for that row into Detail, and that will force the scatter. Alternatively, you can go to the Analysis menu and uncheck Aggregate Measures.
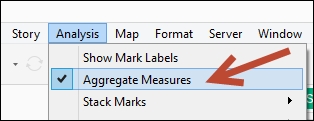
Notice that when you uncheck Aggregate Measures, the measure pills in your Rows and Columns will now be in disaggregated format, that is, Salary/Winnings $ instead of SUM(Salary/Winnings $).
In this recipe, we also added Sport to Color in the Marks card, so that we can visually identify which points belong to which Sport. Tableau 10 also introduces the data highlighter, which you can activate by right-clicking on a pill you have used in your view and selecting Show Highlighter.
In previous versions, the color legend allows you to highlight the points in the view, based on the color you select from the legend. The data highlighter is an improvement to this, and allows you to highlight the points interactively on hover, based on values you specify, or values that match a pattern, on the highlighter card.
For example, when you click on the Highlight Sport field, the list of values will appear. As you hover over the values, the corresponding Sport in the Color property is highlighted, as well as all the points in the scatter plot that belong to that sport.
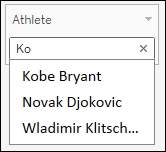
The highlighter, however, can also work with the other dimensions you have used in your canvas, not just the pill that is in Color. For example, you can show the highlighter for player. This allows you to search for players, and highlight them in the scatter plot.