


Stacked bar charts, like regular bar charts, represent numeric values as segmented bars, and each bar is a specific, distinct category. The segments in the bar that are stacked on top of each other represent related values, and the total length of the bar represents the cumulative total of the related values for that category.
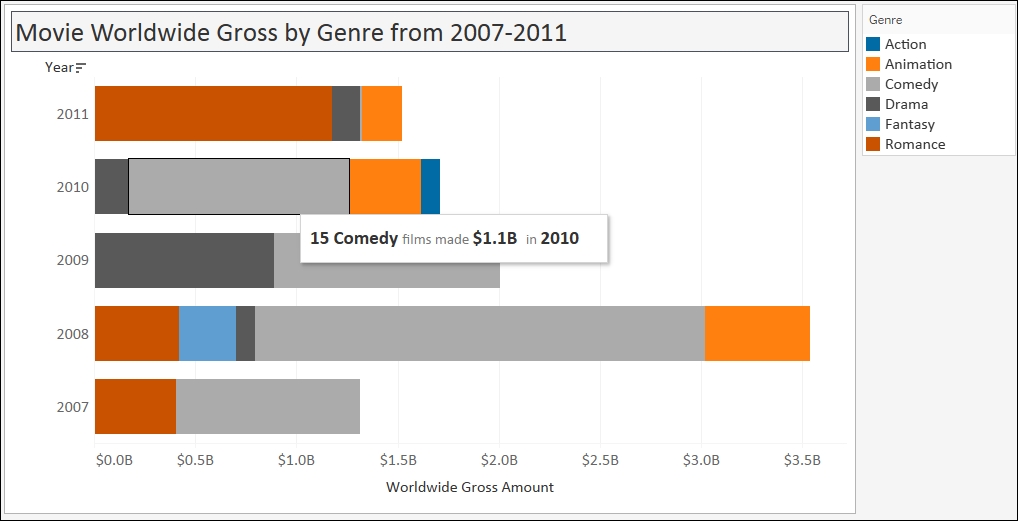
In this recipe, we will create a stacked bar chart that represents the top movies by year, further segmented by genre.
To follow this recipe, open B05527_01 – STARTER.twbx. Use the worksheet called Stacked Bar, and connect to the HollywoodMostProfitableStories data source.
The following are the steps to create the stacked bar chart:
From Dimensions, drag Year to Rows.
From Measures, drag Worldwide Gross Amount to Columns.
Right-click on the Worldwide Gross Amount axis and select Format…. The original data side bar will now be replaced by the format side bar for the axis.

Under the Scale section, change the Numbers format to Currency (Custom), with
1decimal place, and unit in Billions (B).
Hover your mouse pointer over the Year column header, and click twice on the sort icon that appears. The first click sorts the years in ascending order. The second click will sort the years in descending order, with the latest year at the top and earliest year at the bottom.

Right-click on the Worldwide Gross Amount axis and select Edit Axis.
Under the Tick Marks tab in the Major tick marks section, select Fixed and set it for every 500,000,000 units.

From Dimensions, drag Genre to Color in the Marks card. This will create the stacked bar.
Click on the drop-down arrow beside the color legend and choose Edit Colors….
Choose the Color Blind 10 palette and click on Assign Palette. Click on OK when done.
Adjust the width and height of the bars. You can do this by moving your mouse pointer to the column or row edge of a year until you see a double-headed arrow. The left-right double-headed arrow allows you to adjust the width, and the up-down double-headed arrow allows you to adjust the height.
From Dimensions, right-click and drag Film to Detail in the Marks card. This will open a window providing options on what exact detail needs to be added to the card.
Choose CNTD(Film), which means the number of unique films. CNTD is the Count Distinct function.

Click on Tooltip in the Marks cards, and add the following tooltip. Note that data points that you have already used in your worksheet (or viz) can be inserted into the tooltip.

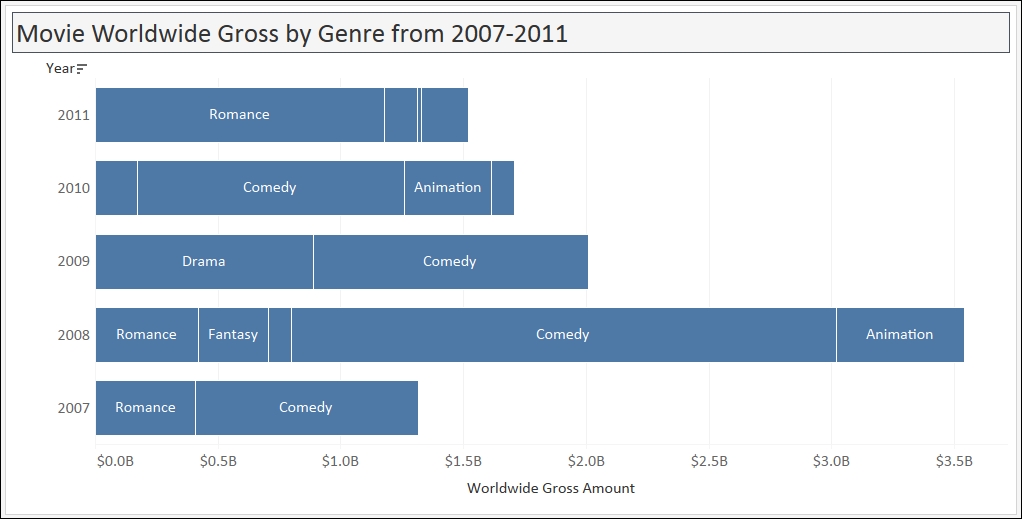
A stacked bar chart is simply a bar chart that has bars that are further segmented or split based on some criteria. Stacked bar charts have related values stacked on top of each other, and are best used when we want to see cumulative totals instead of individual values.
To create a stacked bar chart, you simply need to drop a discrete field onto a formatting card in your Marks card.
Note
Discrete and continuous fields are discussed in more detail in Appendix C, Working with Tableau 10.
The Marks card contains additional properties, and depending on the type of mark, there may be a sixth property that appears. To create segments in a bar, we can add the discrete field in any of the following: Color, Size, Label, and Detail.
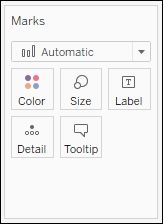
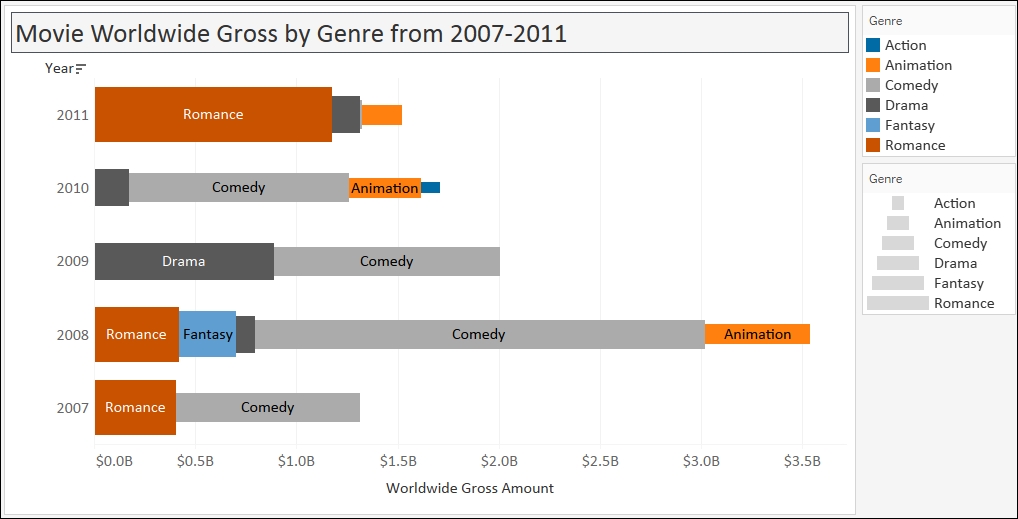
The Color tool is often used in stacked bar charts as this splits the bar into different, discernible colors. In this recipe, we started by using a bar chart that represents the top grossing films in 2007-2011. We placed the dimension Genre onto Color, which created the color partitions in our graph based on Genre.
However, depending on what you're displaying, you may also consider using Size:
You can also segment the bars by Label:
You could also use the combination of Color, Size, and Label:
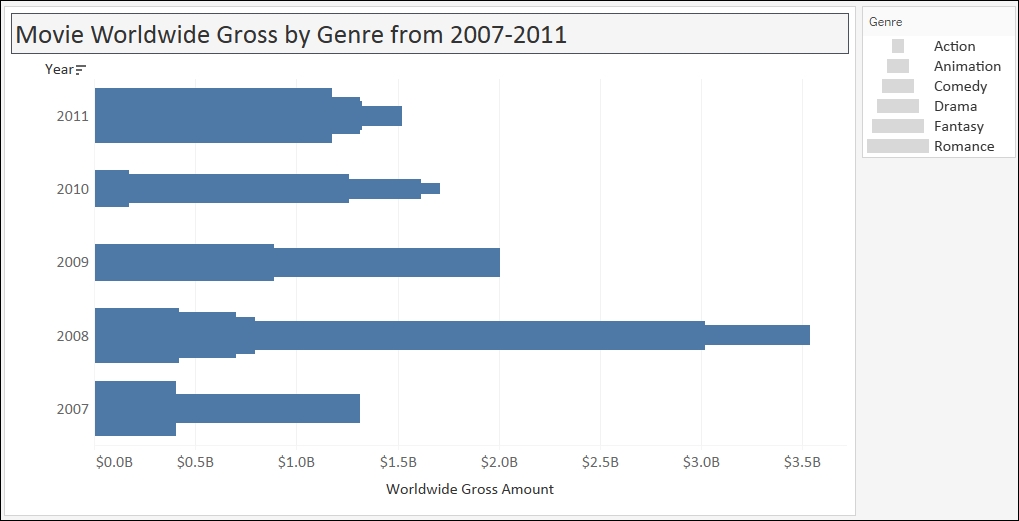
The Detail property will also work, but this does not make the segmentation obvious. It simply creates the very thin borders around the segment—which can be easily overlooked.
I encourage you to be adventurous—see what's possible! Tableau allows you to explore possibilities with ease, which is one thing I really love about the tool. I may not necessarily use that combination, but seeing the combination might open up possibilities for me, or see data in a different light, or it might help uncover insights that were previously buried when we were analyzing using a single formatting card.
It might be tricky to use Show Me to generate a stacked bar chart because the fields placed in Rows, Columns, and Headers are automatically assigned. After the initial chart is generated from Show Me, you may need to swap axes, or move pills around.
In addition, be careful when using stacked bar charts. Stacked bar charts are great when you still want to see that cumulative number. However if you wanted to see and compare each individual segment, it will make your analysis hard because the not all of the segments have the same starting point.
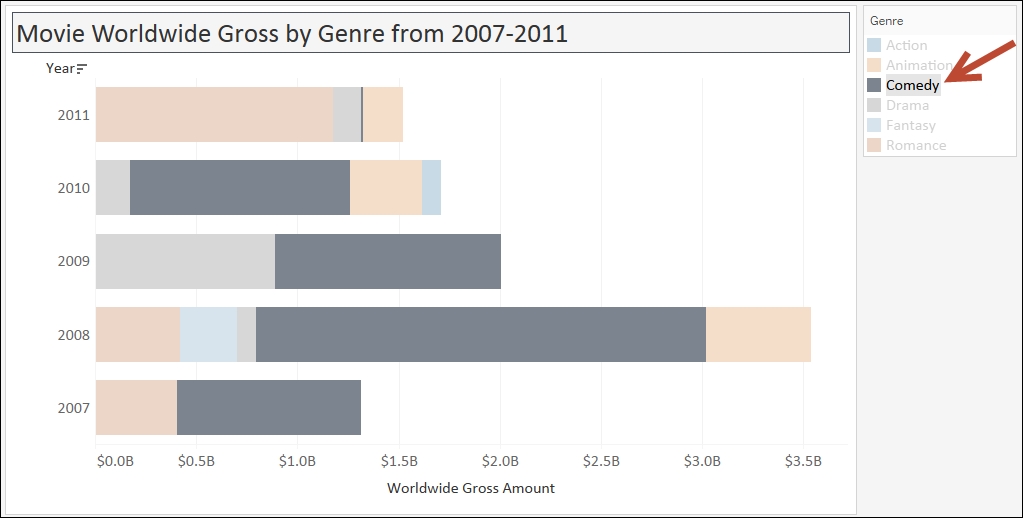
In the previous screenshot, if you highlight just Comedy, you will see that the bars in each year don't start at the same point, therefore it is harder to compare them. For example, can we easily tell that the Worldwide Gross Amount for Comedy is greater for 2010 compared to 2009? It is hard to tell from this graph.