


In a perfect world, we wouldn't even need to have this chapter. In a perfect world, we would have perfect, clean data that we could easily analyze in Tableau. But, alas, in reality, the data that we need to use will most likely need to be cleaned, transformed, and managed before we can effectively use it in Tableau.
There are tools that exclusively help clean and re-shape data. Many refer to these as ETL (Extract, Transform, and Load) tools. While Tableau is not an ETL tool, it has the ability to help clean or prepare data if it is not possible to clean or prepare it at the data source. Calculated fields, discussed in Appendix A, Calculated Fields Primer, are also invaluable in the data cleaning process.
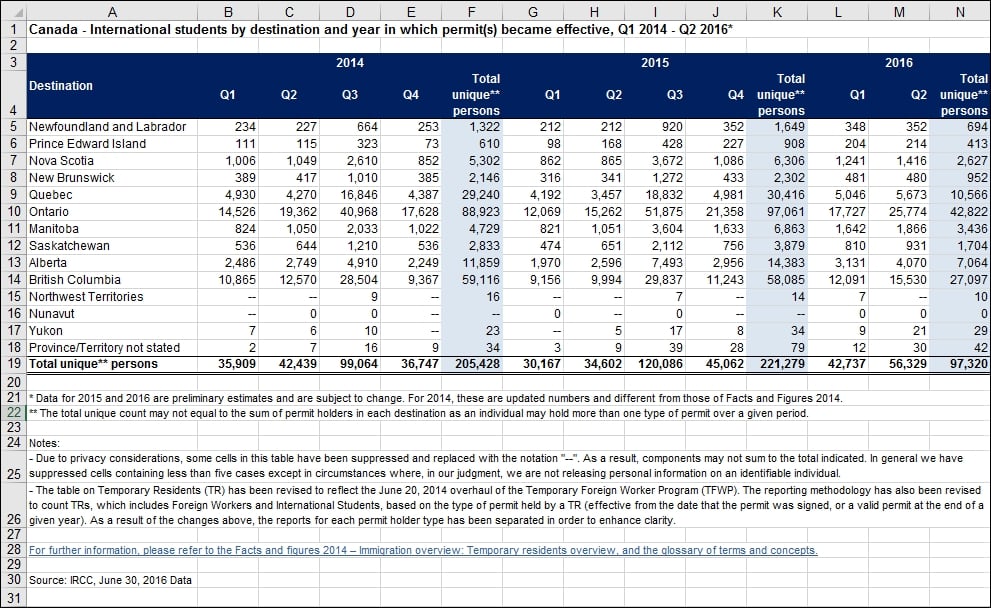
In this recipe, we will clean up the following spreadsheet on Canada international student permits and ready it for Tableau:
To follow this recipe, download the file from the Citizenship and Immigration Canada website using the following URL:
http://www.cic.gc.ca/opendata-donneesouvertes/data/IRCC_IS_0004_E.xls
Here are the steps to clean up the file:
Connect to the Excel file in this recipe. Make sure you choose Excel from the To a File section:

Check the checkbox beside Use Data Interpreter. Note that when this checkbox is checked, the label changes to Cleaned with Data Interpreter:

Select all fields except for Destination.
While the fields are selected, right-click and choose Pivot:

Right-click the new fields to rename them:
Change Pivot Field Names to Period
Change Pivot Field Values to International Students

Click on Add underneath Filters:

In the Select a field: option, choose Period:

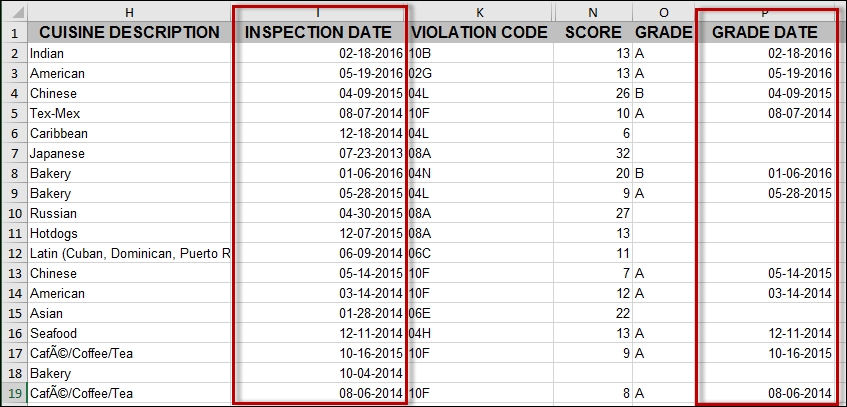
In this recipe, we will use the New York Restaurant Inspections Excel file and use the legacy Jet driver to shape the file so we can have both the inspection date and grade date in the same column. This will allow us to visualize how many restaurants were inspected and graded for a specific date:
To follow this recipe, download the file from the New York City Open Data website using the following URL:
Once you have downloaded the data, save the file as DOHMH_New_York_City_Restaurant_Inspection_Results.xls (Microsoft Excel 97-2003 Worksheet). Note that the records may have been updated between the time of writing and the time of your download.

In this recipe, we will use a schema.ini file to resolve the data types when we connect to a fixed width text file data source with four columns.
To follow this recipe, download this chapter's files from the Packt website and use the file called Fixed Width Sample.txt.
This is what the file looks like when opened in a text editor showing special characters:
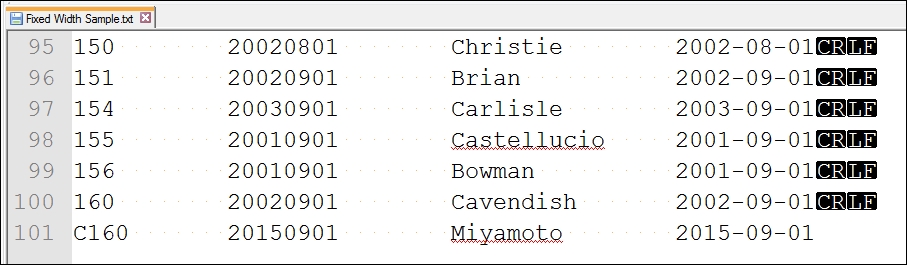
Note that this file does not have any column headers. In addition, note the following:
The first column should be text
The second column should be integers
The third column should be text
The fourth column should be dates
Here are the steps to use the .ini file with the fixed width text file:
Create a text file with the following contents:

Save the file as
schema.iniand save it in the same directory as theFixed Width Sample.txtfile.Connect to the text file in Tableau:

Confirm that there are four fields in the Tableau preview window, with the same configuration as specified...
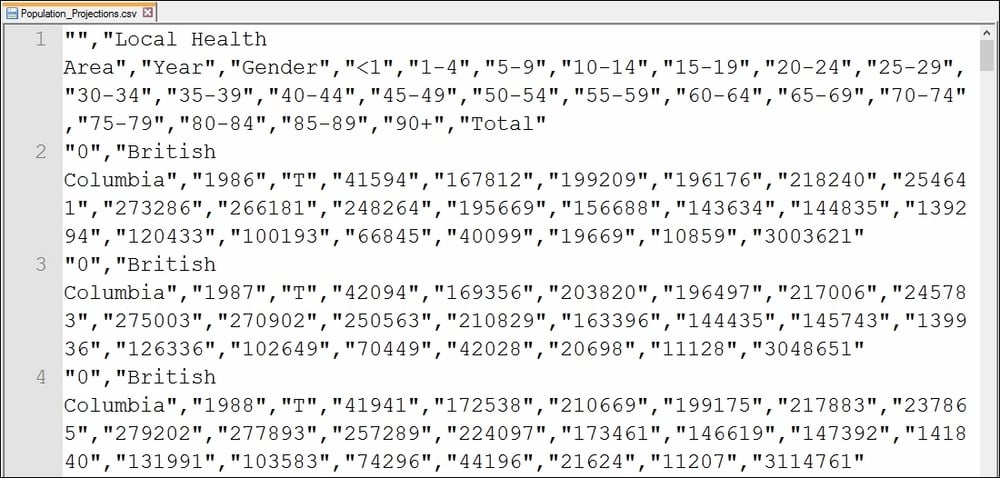
In this recipe, we will prepare the data set that we used in the Creating a population pyramid recipe of Chapter 2, Advanced Charts. The original file, which is a comma separated value (CSV) file, looks like the following:
To follow this recipe, download the file from BCStats using the following URL:
http://www.bcstats.gov.bc.ca/StatisticsBySubject/Demography/PopulationProjections.aspx.
When you download, make the following selections and click on Generate Output:
Select British Columbia for Region
Select all the years
Select totals
Select 5-Year Age Groups

Beside the result pane, click on the CSV icon at the top-right corner of the result pane to download the .csv file. Save the file as Population_Projections.csv.

In this recipe, we will combine a number of comma separated value (CSV) files into a single data set in Tableau.
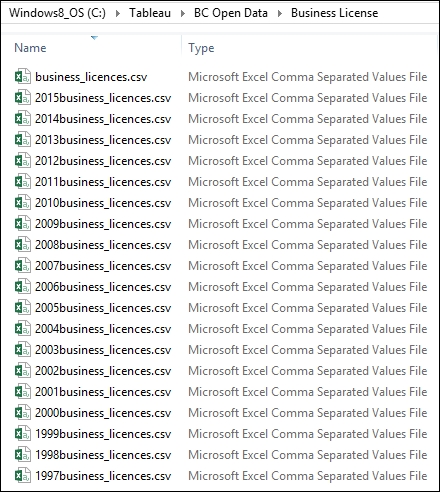
To follow this recipe, download the business license files from the City of Vancouver's website from http://data.vancouver.ca/datacatalogue/businessLicence.htm:
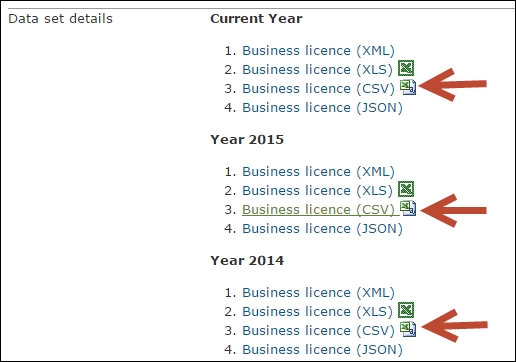
Download the CSV version, and save all the files in a local directory in your computer:
Here are the steps to prepare the data files:
Click on New Data Source icon and connect to
business_licenses.csvwhich contains the most recent year's records:
Drag New Union to just underneath the
business_licenses.csvuntil you see the Drag table to union message:
Select all other CSV files from the Files pane and drag them to the Union window:

Click on OK after you confirm that all the files have been added to the Union window:

Add a new sheet and create your visualization using this data set.
In this recipe, we will combine the fields in two different Excel worksheets into one:
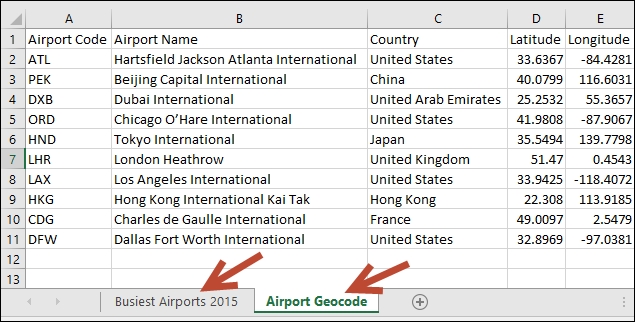
To follow this recipe, download this chapter's files from the Packt website and use the file called Worlds Busiest Airports—Join.xls.
Here are the steps to combine the fields from the two worksheets:
Connect to the Excel file in this recipe. Make sure you choose Excel from the To a File section:

Drag Busiest Airports 2015 from the sheets section to the data connection window:

Drag Airport Geocode to the right of Busiest Airports 2015 in the data connection window.
In the Join window that comes up, choose Airport from Busiest Airports 2015 to match up to the Airport Code field from the Airport Geocode sheet:

Add a new sheet and create your visualization using this data set.
In this recipe, we will combine the records from a text file and an Excel file using a blend.
To follow this recipe, download this chapter's files from the Packt website and use the following files:
The
Airport Geocode—Blend.csvfileThe Worlds
Busiest Airports—Blend.xlsxfile
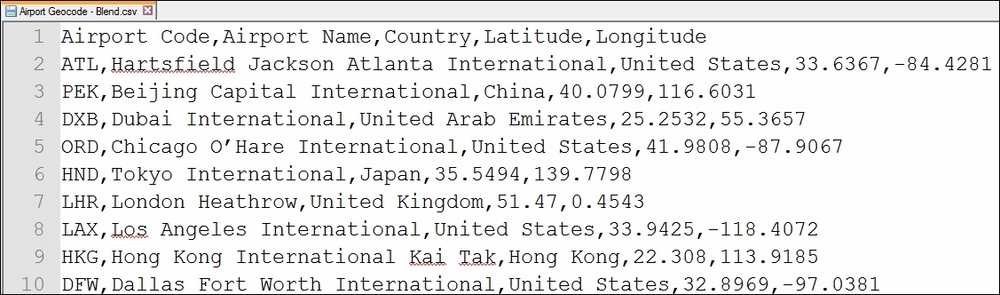
This is the content of the Airport Geocode—Blend.csv file:
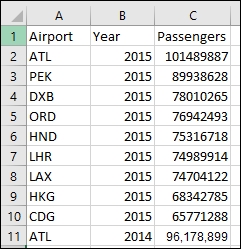
These are the records in the Worlds Busiest Airports - Blend.xlsx file:
Here are the steps to blend the two data sources:
Connect to the Excel file in this recipe. Make sure you choose Excel from the To a File section:

Go to new worksheet:

Click on the New Data Source icon, and this time connect to a Text file. Connect to the text file in this recipe:

If you are directed back to the initial connection screen, go back to sheet 1.
Under the Data menu, click on Edit Relationships:

While Airport Geocode—Blend is selected as the Primary data source, click on Custom and match up the Airport Code field to Airport:

Click on OK when done.
While...