Reader small image

You're reading from  Learning Tableau 2022 - Fifth Edition

Product typeBook
Published inAug 2022
PublisherPackt
ISBN-139781801072328
Edition5th Edition
Tools
Right arrow
Author (1)
Joshua N. Milligan
Joshua N. Milligan
author image
Joshua N. Milligan

Joshua N. Milligan is a Hall of Fame Tableau Zen Master and 2017 Iron Viz Global finalist. His passion is training, mentoring, and helping people gain insights and make decisions based on their data through data visualization using Tableau and data cleaning and structuring using Tableau Prep. He is a principal consultant at Teknion Data Solutions, where he has served clients in numerous industries since 2004.
Read more about Joshua N. Milligan

Right arrow

Explain Data

With Explain Data, you can begin to uncover some of the reasons and explanations behind the data you see in your visualizations. Why are sales up so much at a specific point on the timeline? Why was profit down so much last month? Explain Data takes some of the tedious manual effort out of hunting for answers to questions like these.

To use Explain Data, simply select a mark in a view that you’d like to understand and select the Explain Data option on the tooltip toolbar (it looks like a lightbulb). For example, we’ll take the data shown in the Price vs. Size scatterplot we examined in Figure 9.13. Specifically we’ll examine the two most significant outliers.

First select the mark for 803 Parkhill Dr. Mansfield TX 76063 in the Testing predictions sheet (shown in Figure 9.21 and then click the Explain Data toolbar option as shown here:

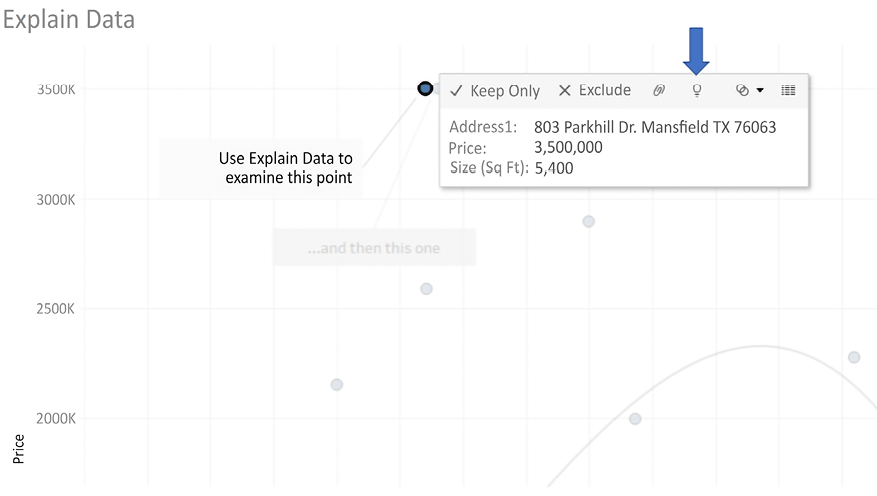
Figure 9.21: Selecting a mark for Explain Data

This opens the Explain Data pane, which looks...

lock icon
The rest of the page is locked
Previous PageNext Page
You have been reading a chapter from
Learning Tableau 2022 - Fifth Edition
Published in: Aug 2022Publisher: PacktISBN-13: 9781801072328

Author (1)

author image
Joshua N. Milligan

Joshua N. Milligan is a Hall of Fame Tableau Zen Master and 2017 Iron Viz Global finalist. His passion is training, mentoring, and helping people gain insights and make decisions based on their data through data visualization using Tableau and data cleaning and structuring using Tableau Prep. He is a principal consultant at Teknion Data Solutions, where he has served clients in numerous industries since 2004.
Read more about Joshua N. Milligan