Reader small image

You're reading from  Learning Tableau 2022 - Fifth Edition

Product typeBook
Published inAug 2022
PublisherPackt
ISBN-139781801072328
Edition5th Edition
Tools
Right arrow
Author (1)
Joshua N. Milligan
Joshua N. Milligan
author image
Joshua N. Milligan

Joshua N. Milligan is a Hall of Fame Tableau Zen Master and 2017 Iron Viz Global finalist. His passion is training, mentoring, and helping people gain insights and make decisions based on their data through data visualization using Tableau and data cleaning and structuring using Tableau Prep. He is a principal consultant at Teknion Data Solutions, where he has served clients in numerous industries since 2004.
Read more about Joshua N. Milligan

Right arrow

Dynamic Dashboards

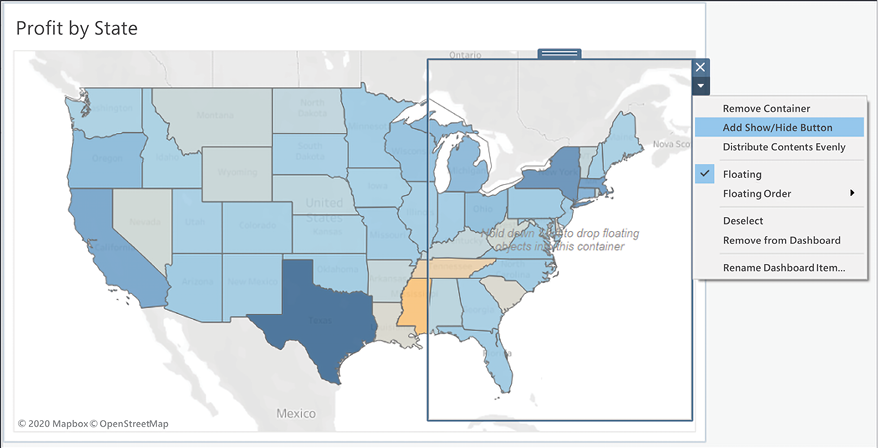
We’ve looked at dashboards previously, in Chapter 8, Telling a Data Story with Dashboards, and considered how to make them interactive using a variety of actions. Now we’ll expand on that concept to consider how to create truly dynamic dashboards—dashboards where objects can be shown and hidden. This enables you to do all kinds of amazing things, such as allow the user to select which type of visualization to see or to dynamically hide or show controls that are relevant or desired.

We’ll consider the following types of dynamic interactivity:

  • Show/Hide buttons
  • Sheet swapping
  • Automatically showing and hiding controls

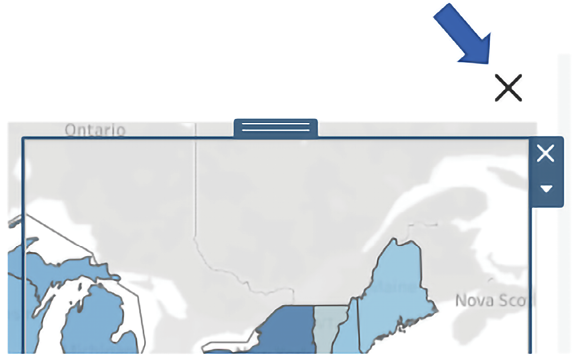
Let’s start by considering how to show and hide content on dashboards using Show/Hide buttons.

Show/Hide buttons

Show/Hide buttons allow you to show and hide layout containers (and everything in them!). You’ll find a couple of examples in the Chapter 11 Complete workbook. The Chapter 11 Starter workbook has the dashboards, but not the Show/Hide buttons or containers. The images used in the second example are also in the Chapter 11 directory.

To use the Show/Hide buttons, add a layout container to a dashboard as a floating object and then use the dropdown to select Add Show/Hide Button, as shown here in Figure 11.1:

Figure 11.1: A dashboard with a single map view and a floating layout container

On this dashboard, we’ve added a vertical layout container floating over the map. When we select Add Show/Hide Button, Tableau adds a small button to the dashboard:

Figure 11.2: The Show/Hide button for the layout container

A Show/Hide button can be applied to any single floating layout container on the dashboard.

Use the Rename Dashboard...

Sheet swapping

Sheet swapping, sometimes also called sheet selection, is a technique in which views are dynamically shown and hidden on a dashboard, often with the appearance of swapping one view for another. The dynamic hiding and showing of views on a dashboard has an even broader application. When combined with floating objects and layout containers, this technique allows you to create rich and dynamic dashboards.

Let’s start with some fundamental principles of sheet swapping.

Basic principles of sheet swapping

The basic principles are relatively simple. A view on a dashboard collapses when the following occur:

  • At least one field is on rows or columns
  • It is in a horizontal or vertical layout container
  • It does not have a fixed height or width and the layout container is not set to distribute items equally
  • A combination of filters or hiding prevents any marks from being rendered

Additionally, titles and captions do not collapse with the view. However, they can be hidden so that the view collapses entirely.

Next, we’ll explore an example of how sheet swapping can be used in practice.

Using sheet swapping to change views on a dashboard

Let’s consider a simple example with a view showing Profit by Department and Category with a Department quick filter.

The dashboard has been formatted (from the menu, select Format | Dashboard) with gray shading to help us see the effect:

Figure 11.8: A demonstration of hiding a sheet in a dashboard

Observe how filtering out all departments results in a blank view. The title remains which prevents the view from collapsing. We’ll remove titles in the next example to complete the sheet swapping.

In order to swap two different sheets, we simply take advantage of the collapsing behavior along with the properties of layout containers. We’ll start by creating two different views filtered through a parameter and a calculated field. The parameter will allow us to determine which sheet is shown. Perform the following steps:

  1. Create an integer parameter named Show Sheet with a list of String...

Automatically showing and hiding other controls

Views will collapse when all data is filtered out. However, other controls, such as quick filters, parameters, images, legends, and textboxes, will not collapse. You could use a Show/Hide button as we previously discussed, but often you’ll want to show or hide these controls automatically as filters change, without forcing the user to take additional action.

Consider the simple example in the previous section. The color legend, which was automatically added to the dashboard by Tableau, applies to the map. But when the bar chart is shown, the legend is no longer applicable.

Fortunately, we can extend the technique we used in the previous section to expand a view to push items we want to show out from under a floating object and then collapse the view to allow the items we want to hide to return to a position under the floating object.

Let’s extend the earlier sheet swapping example to see how to show and hide...

Summary

Creating truly dynamic dashboards gives you incredible flexibility in your dashboard design. Show/Hide buttons give the end user the option to show or hide content on the dashboard. Sheet-swapping techniques allow you to swap out which views are shown and also automatically show or hide controls or other content.

The techniques covered in this chapter will enable you to accomplish all sorts of amazing interactivity, from hiding and showing controls, instructions, and explanations of business rules and analysis to allowing users to determine visualization types and swap views in and out.

Next, we’ll turn our attention to exploring a certain kind of data using some advanced techniques: geospatial data!

Join our community on Discord

Join our community’s Discord space for discussions with the author and other readers: https://packt.link/ips2H

lock icon
The rest of the chapter is locked
You have been reading a chapter from
Learning Tableau 2022 - Fifth Edition
Published in: Aug 2022Publisher: PacktISBN-13: 9781801072328
Register for a free Packt account to unlock a world of extra content!
A free Packt account unlocks extra newsletters, articles, discounted offers, and much more. Start advancing your knowledge today.
undefined
Unlock this book and the full library FREE for 7 days
Get unlimited access to 7000+ expert-authored eBooks and videos courses covering every tech area you can think of
Renews at $15.99/month. Cancel anytime

Author (1)

author image
Joshua N. Milligan

Joshua N. Milligan is a Hall of Fame Tableau Zen Master and 2017 Iron Viz Global finalist. His passion is training, mentoring, and helping people gain insights and make decisions based on their data through data visualization using Tableau and data cleaning and structuring using Tableau Prep. He is a principal consultant at Teknion Data Solutions, where he has served clients in numerous industries since 2004.
Read more about Joshua N. Milligan