Search icon
Arrow left icon
All Products
Best Sellers
New Releases
Books
Videos
Audiobooks
Learning Hub
Newsletters
Free Learning
Arrow right icon
Learning Tableau 2022 - Fifth Edition

You're reading from  Learning Tableau 2022 - Fifth Edition

Product type Book
Published in Aug 2022
Publisher Packt
ISBN-13 9781801072328
Pages 568 pages
Edition 5th Edition
Languages
Author (1):
Joshua N. Milligan Joshua N. Milligan
Profile icon Joshua N. Milligan

Table of Contents (20) Chapters

Preface Taking Off with Tableau Connecting to Data in Tableau Moving Beyond Basic Visualizations Starting an Adventure with Calculations and Parameters Leveraging Level of Detail Calculations Diving Deep with Table Calculations Making Visualizations that Look Great and Work Well Telling a Data Story with Dashboards Visual Analytics: Trends, Clustering, Distributions, and Forecasting Advanced Visualizations Dynamic Dashboards Exploring Mapping and Advanced Geospatial Features Integrating Advanced Features: Extensions, Scripts, and AI Understanding the Tableau Data Model, Joins, and Blends Structuring Messy Data to Work Well in Tableau Taming Data with Tableau Prep Sharing Your Data Story Other Books You May Enjoy
Index

Waterfall charts

A waterfall chart is useful when you want to show how parts successively build up to a whole. In the following screenshot, for example, a waterfall chart shows how profit builds up to a grand total across Department and Category of products. Sometimes profit is negative, so at that point, the waterfall chart takes a dip, while positive values build up toward the total:

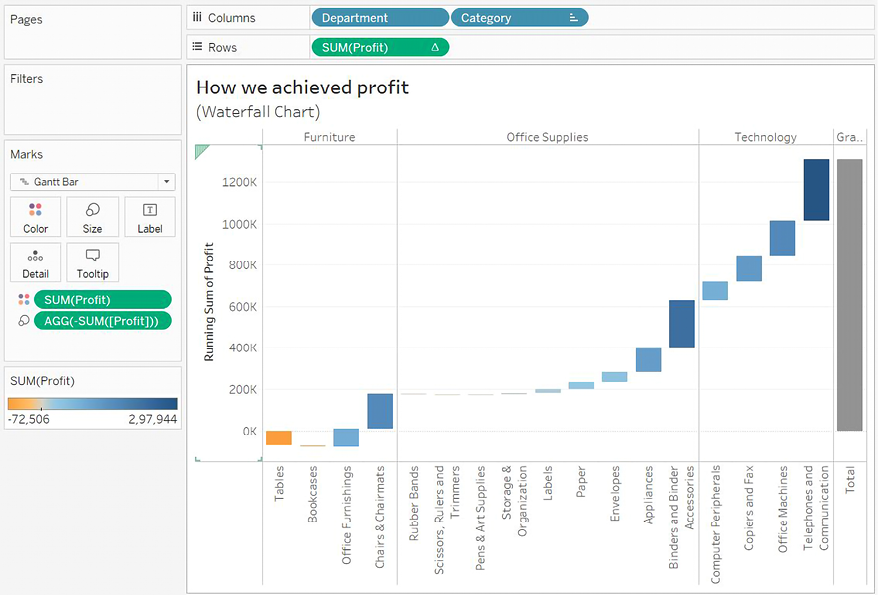
Figure 10.3: This waterfall chart shows how each Category adds (or subtracts) profit to build toward the total

Here are the features and techniques used to build the chart:

  • The SUM(Profit) field on Rows is a Running Total table calculation (created using a Quick Table Calculation from the drop-down menu) and is computed across the table.
  • Row Grand Totals have been added to the view (dragged and dropped from the Analytics pane).
  • The mark type is set to Gantt Bar and an ad hoc calculation is used with code: SUM(Profit) for the size. This may seem a bit odd at first...
lock icon The rest of the chapter is locked
Register for a free Packt account to unlock a world of extra content!
A free Packt account unlocks extra newsletters, articles, discounted offers, and much more. Start advancing your knowledge today.
Unlock this book and the full library FREE for 7 days
Get unlimited access to 7000+ expert-authored eBooks and videos courses covering every tech area you can think of
Renews at $15.99/month. Cancel anytime}