Reader small image

You're reading from  Learning Responsive Data Visualization

Product typeBook
Published inMar 2016
Reading LevelIntermediate
Publisher
ISBN-139781785883781
Edition1st Edition
Languages
Tools
Right arrow
Authors (2):
Erik Hanchett
Erik Hanchett
author image
Erik Hanchett

Erik Hanchett is a software developer, blogger, and perpetual student who has been writing code for over 10 years. He currently resides in Reno Nevada, with his wife and two kids. He blogs about software development at ProgramWithErik.com. I would like to thank my wife Susan for helping me stay motivated. My friend F.B. Woods for all his help on the English language and Dr. Bret Simmons for teaching me the value of a personal brand. I would also like to thank all my friends and family that encouraged me along the way.
Read more about Erik Hanchett

Christoph Körner
Christoph Körner
author image
Christoph Körner

Christoph Körner previously worked as a cloud solution architect for Microsoft, specializing in Azure-based big data and machine learning solutions, where he was responsible for designing end-to-end machine learning and data science platforms. He currently works for a large cloud provider on highly scalable distributed in-memory database services. Christoph has authored four books: Deep Learning in the Browser for Bleeding Edge Press, as well as Mastering Azure Machine Learning (first edition), Learning Responsive Data Visualization, and Data Visualization with D3 and AngularJS for Packt Publishing.
Read more about Christoph Körner

View More author details
Right arrow

Panning and zooming


Besides clicking onto the data points, bars, and elements in the visualization, a common interaction is zooming and panning. This helps the user to change from smaller view to a more detailed view of the data. Having in mind everything you have learned so far, it would also make sense to increase the data resolution while you zoom. The more the user zooms into the visualization, the higher the data resolution.

Similar to the previous chapter, there are multiple ways to implement them. We will look at the different possibilities and compare them by zooming into the chart in the following picture:

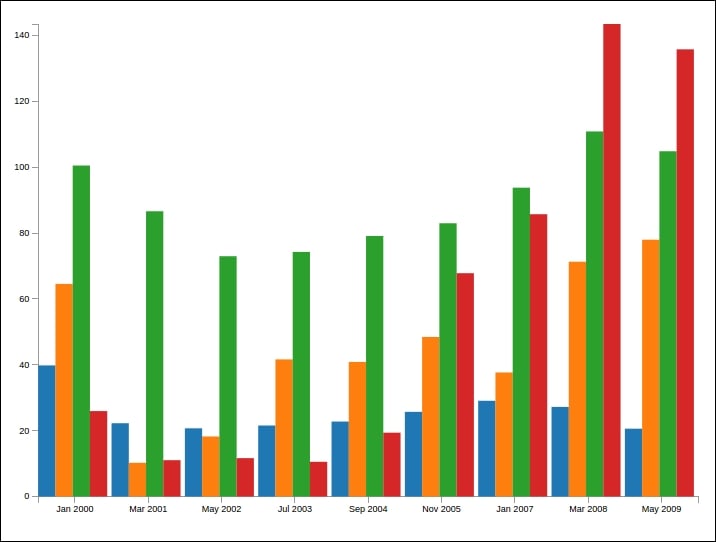
A simple bar chart in a grid layout

A simple zoom

Let's first start with a very simple zoom. In many cases, mostly when we use data representations without axis, we want to provide the user a way to simply enlarge the view of the visualization.

To implement this effect, we can use SVG's native transform functions, such as scale and translate, and apply them to a container element that...

lock icon
The rest of the page is locked
Previous PageNext Page
You have been reading a chapter from
Learning Responsive Data Visualization
Published in: Mar 2016Publisher: ISBN-13: 9781785883781

Authors (2)

author image
Erik Hanchett

Erik Hanchett is a software developer, blogger, and perpetual student who has been writing code for over 10 years. He currently resides in Reno Nevada, with his wife and two kids. He blogs about software development at ProgramWithErik.com. I would like to thank my wife Susan for helping me stay motivated. My friend F.B. Woods for all his help on the English language and Dr. Bret Simmons for teaching me the value of a personal brand. I would also like to thank all my friends and family that encouraged me along the way.
Read more about Erik Hanchett

author image
Christoph Körner

Christoph Körner previously worked as a cloud solution architect for Microsoft, specializing in Azure-based big data and machine learning solutions, where he was responsible for designing end-to-end machine learning and data science platforms. He currently works for a large cloud provider on highly scalable distributed in-memory database services. Christoph has authored four books: Deep Learning in the Browser for Bleeding Edge Press, as well as Mastering Azure Machine Learning (first edition), Learning Responsive Data Visualization, and Data Visualization with D3 and AngularJS for Packt Publishing.
Read more about Christoph Körner