Reader small image

You're reading from  gnuplot Cookbook

Product typeBook
Published inFeb 2012
PublisherPackt
ISBN-139781849517249
Edition1st Edition
Tools
Right arrow
Author (1)
Lee Phillips
Lee Phillips
author image
Lee Phillips

Lee Phillips grew up on the 17th floor of a public housing project on the Lower East Side of Manhattan. He attended Stuyvesant High School and Hampshire College, where he studied Physics, Mathematics, and Music. He received a Ph.D. in 1987 from Dartmouth in theoretical and computational physics for research in fluid dynamics. After completing post-doctoral work in plasma physics, Dr. Phillips was hired by the Naval Research Laboratory in Washington, DC, where he worked on various problems, including the NIKE laser fusion project. Dr. Phillips is now the Chief Scientist of the Alogus Research Corporation, which conducts research in the physical sciences and provides technology assessment for investors.
Read more about Lee Phillips

Right arrow

Plotting with polar coordinates


All the plots in this chapter up to now have implicitly used rectangular coordinates, usually denoted as x and y. For certain types of information, however, polar geometry is the natural coordinate system. In polar coordinates we have a radius, r, measured from the origin, usually at the center of the graph, and an angle, θ, usually measured counter-clockwise from the horizontal. On the gnuplot command line, the angular coordinate is called t by default. The following is an example of a spiral illustration:

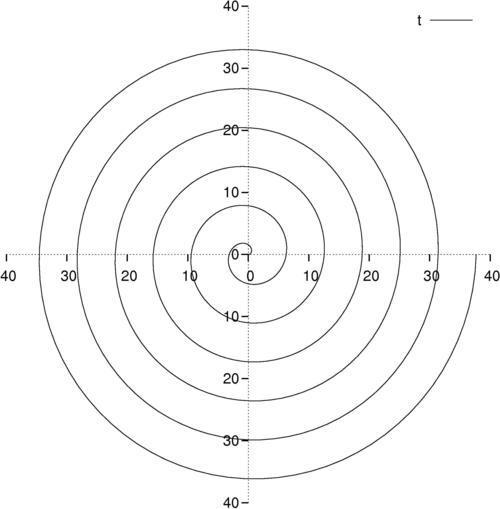
Using polar coordinates we can plot spirals and closed curves that are impossible to define explicitly using rectangular coordinates.

How to do it…

Following is an example of how to use polar coordinates to get the spiral shown in the previous illustration:

set xtics axis nomirror
set ytics axis nomirror
set zeroaxis
unset border
set samples 500
set polar
plot [0:12*pi] t

How it works…

The first three lines create a pair of axes that intersect at the origin in the center of the graph. This works for polar plots too, where we are measuring the radius from the center. The unset border line removes the frame that has served up to now as axes for our rectangular coordinate plots. Next, we increase the number of samples for a smooth plot. The crucial, highlighted line set polar changes to polar (r-θ) coordinates from the default rectangular (x-y). In the plot command, t is now a dummy variable that passes through the given angular range (default [0:2*pi], changed to [0:12*pi] here), and the provided function (r) is a function of t, in this case the identity, that yields a circular spiral.

Previous PageNext Chapter
You have been reading a chapter from
gnuplot Cookbook
Published in: Feb 2012Publisher: PacktISBN-13: 9781849517249
Register for a free Packt account to unlock a world of extra content!
A free Packt account unlocks extra newsletters, articles, discounted offers, and much more. Start advancing your knowledge today.
undefined
Unlock this book and the full library FREE for 7 days
Get unlimited access to 7000+ expert-authored eBooks and videos courses covering every tech area you can think of
Renews at $15.99/month. Cancel anytime

Author (1)

author image
Lee Phillips

Lee Phillips grew up on the 17th floor of a public housing project on the Lower East Side of Manhattan. He attended Stuyvesant High School and Hampshire College, where he studied Physics, Mathematics, and Music. He received a Ph.D. in 1987 from Dartmouth in theoretical and computational physics for research in fluid dynamics. After completing post-doctoral work in plasma physics, Dr. Phillips was hired by the Naval Research Laboratory in Washington, DC, where he worked on various problems, including the NIKE laser fusion project. Dr. Phillips is now the Chief Scientist of the Alogus Research Corporation, which conducts research in the physical sciences and provides technology assessment for investors.
Read more about Lee Phillips