Reader small image

You're reading from  gnuplot Cookbook

Product typeBook
Published inFeb 2012
PublisherPackt
ISBN-139781849517249
Edition1st Edition
Tools
Right arrow
Author (1)
Lee Phillips
Lee Phillips
author image
Lee Phillips

Lee Phillips grew up on the 17th floor of a public housing project on the Lower East Side of Manhattan. He attended Stuyvesant High School and Hampshire College, where he studied Physics, Mathematics, and Music. He received a Ph.D. in 1987 from Dartmouth in theoretical and computational physics for research in fluid dynamics. After completing post-doctoral work in plasma physics, Dr. Phillips was hired by the Naval Research Laboratory in Washington, DC, where he worked on various problems, including the NIKE laser fusion project. Dr. Phillips is now the Chief Scientist of the Alogus Research Corporation, which conducts research in the physical sciences and provides technology assessment for investors.
Read more about Lee Phillips

Right arrow

Handling financial data


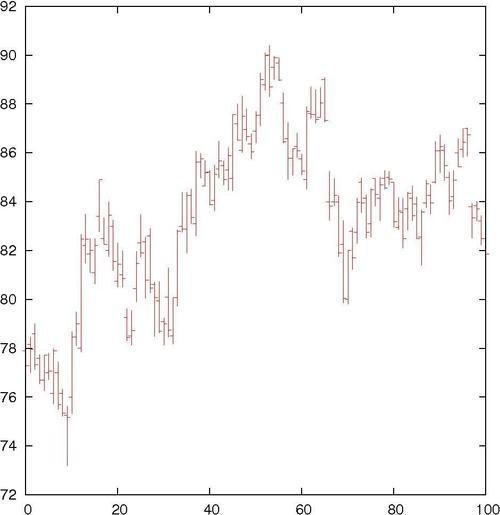
Although gnuplot was originally envisioned as a scientist's companion, it has proven to be a worthy and reliable friend to financial analysts. Financial plotting comes with its own set of complex problems, some of which we'll have to defer to later chapters; in the following figure, we illustrate the basic financial plotting style:

This type of plot will be familiar to you if you follow the stock market.

Getting ready

Sample financial data is essential for illustrating financial plotting. Fortunately, the gnuplot distribution comes with an appropriate sample datafile. In case you don't have it, we have provided a copy called finance.dat. Make sure it's in your current directory so that gnuplot can find it. You are welcome, of course, to use your own data, but it must be in the correct format. Each line of the file represents a separate data point, and consists of (at least) five numbers, separated by spaces: date open low high close.

An example of a line from such a datafile would look similar to the following:

3/11/2011  76.15  76.63  75.2  75.35

How to do it…

Enter the following commands while you are in the directory containing the datafile:

set bars 2
plot [0:100] 'finance.dat' using 0:2:3:4:5 notitle with financebars

How it works…

This makes the conventional financial graph showing the high, low, open, and close prices for a stock. If you are reading this recipe, you no doubt already know why you want this type of plot.

The default size of the tics for the opening and closing prices is quite small; the first command makes it longer. The second command sets the range, chooses the file, and specifies the columns to use for the finance plot.

Previous PageNext Page
You have been reading a chapter from
gnuplot Cookbook
Published in: Feb 2012Publisher: PacktISBN-13: 9781849517249
Register for a free Packt account to unlock a world of extra content!
A free Packt account unlocks extra newsletters, articles, discounted offers, and much more. Start advancing your knowledge today.
undefined
Unlock this book and the full library FREE for 7 days
Get unlimited access to 7000+ expert-authored eBooks and videos courses covering every tech area you can think of
Renews at $15.99/month. Cancel anytime

Author (1)

author image
Lee Phillips

Lee Phillips grew up on the 17th floor of a public housing project on the Lower East Side of Manhattan. He attended Stuyvesant High School and Hampshire College, where he studied Physics, Mathematics, and Music. He received a Ph.D. in 1987 from Dartmouth in theoretical and computational physics for research in fluid dynamics. After completing post-doctoral work in plasma physics, Dr. Phillips was hired by the Naval Research Laboratory in Washington, DC, where he worked on various problems, including the NIKE laser fusion project. Dr. Phillips is now the Chief Scientist of the Alogus Research Corporation, which conducts research in the physical sciences and provides technology assessment for investors.
Read more about Lee Phillips