


Plotting multiple curves
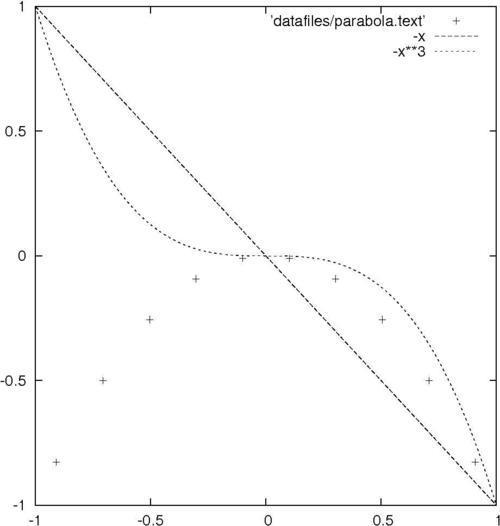
You will often want to plot more than one curve on a single graph, all sharing the same axes. This is simple in gnuplot: just separate the functions or datafiles by commas, and gnuplot will plot them in a sequence of colors or curve styles, with a legend so you can identify them. The following figure shows the plotting of multiple curves:
Getting ready
It will be useful to have some datafiles on your disk for use with some of the plotting recipes. You could make them by hand with a text editor or write a program in your favorite language to generate them, but gnuplot can do this itself. To make a file with data that forms a parabola flipped upside down, tell gnuplot to set table 'parabola.text'. Make sure to include the quotes around the filename. Then say plot -x**2. This writes a table out to the file parabola.text rather than making a picture. Now, say unset table. You should have a file called parabola.text in the directory in which you started gnuplot. Keep it around so we can use it later.
How to do it…
After setting your terminal back to the graphics device you want to use at the gnuplot console, type the following command:
plot [-1:1] 'parabola.text', -x, -x**3
How it works…
Gnuplot plots the curves using three different colors, dash styles, or line thicknesses, depending on the terminal in use, with a legend so you can tell them apart. The functions are plotted as smooth curves, as we did earlier, and the data from the file is plotted as a series of points, by default; one for each point in the range. This can all be adjusted, as we shall see in Chapter 3, Applying Colors and Styles.
Take a look at the datafile that gnuplot created to see the format it understands. After several comment lines beginning with the "#" character, we find a series of x coordinates and y values. The last character on each of these lines is a letter: "i" if the point is in the active range, "o" if it is out of range, or "u" if it is undefined.


