

Along with data often comes error, uncertainty, or the general concept of a range of values associated with each plotted value. To express this in a plot, various conventions can be used; one of these is the "error bar", for which gnuplot has some special styles. The following figure shows an example of an error bar:
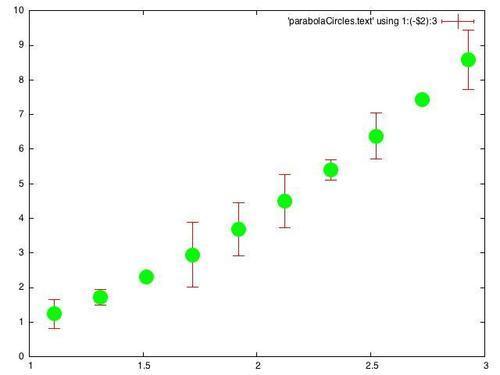
The previous figure has the same data that we used in our previous recipe, Plotting circles, plotted over a restricted range, and using the random number column to supply "errors", which are depicted here as vertical lines with small horizontal caps.
Following is the script for producing a basic data set plot with errorbars:
set pointsize 3
set bars 3
plot [1:3] 'parabolaCircles.text' using 1:(-$2):3 with errorbars,\'' using 1:(-$2):3  pt 7 notitle
We are using our trusty parabola plus the random number file again; here the random numbers will stand in for errors.
The default point size in gnuplot is quite small; the first line in the recipe increases this. This is especially important for presentations, where increasing the size of various plot elements will make your projected slides far easier to see. The second line increases the size of the small horizontal bars on the ends of the error bars; the default is rather small and hard to see. The third line selects the range, flips the parabola as before, and selects the error bars style. If we omit the portion after the comma, the error bars alone are plotted, with another small horizontal bar indicating the data values. This is OK, but the graph is easier to interpret if we plot a more distinct symbol at each data point; that's what the component after the comma does. We use the special file designator '' to mean the file already mentioned; pt is short for point type, and pt 7 gives a solid circle on most terminals. Finally, notitle prevents a second, redundant entry in the legend.
Error bars can be combined with some of the other plot styles. To create the following figure, which combines a box plot with error bars, change the last line in the recipe to the following commands:
set style fill pattern 2 border lt -1
plot [1:3] 'parabolaCircles.text' using 1:(-$2):3 with boxerrorbars
We've just changed errorbars to boxerrorbars, but first we set the fill pattern to a fine hatching pattern, (this will depend on your output device, try the command test to see them) and asked for a black border to be drawn around the boxes.
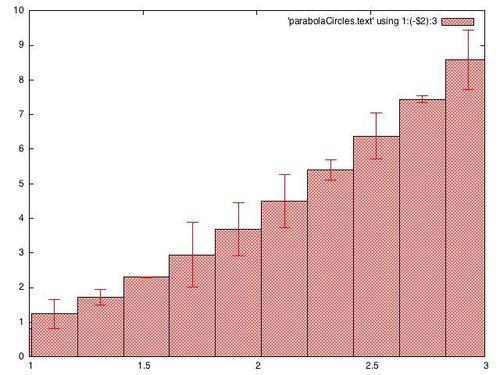
This is the same data plotted in the previous figure, in a different style.