Reader small image

You're reading from  gnuplot Cookbook

Product typeBook
Published inFeb 2012
PublisherPackt
ISBN-139781849517249
Edition1st Edition
Tools
Right arrow
Author (1)
Lee Phillips
Lee Phillips
author image
Lee Phillips

Lee Phillips grew up on the 17th floor of a public housing project on the Lower East Side of Manhattan. He attended Stuyvesant High School and Hampshire College, where he studied Physics, Mathematics, and Music. He received a Ph.D. in 1987 from Dartmouth in theoretical and computational physics for research in fluid dynamics. After completing post-doctoral work in plasma physics, Dr. Phillips was hired by the Naval Research Laboratory in Washington, DC, where he worked on various problems, including the NIKE laser fusion project. Dr. Phillips is now the Chief Scientist of the Alogus Research Corporation, which conducts research in the physical sciences and provides technology assessment for investors.
Read more about Lee Phillips

Right arrow

Making an impulse plot


Impulse or stick plots are another way to represent discrete points. If the line thickness is made large, the impulse plot can be made to look like a bar chart.

How to do it…

The following script illustrates the use of the impulses style:

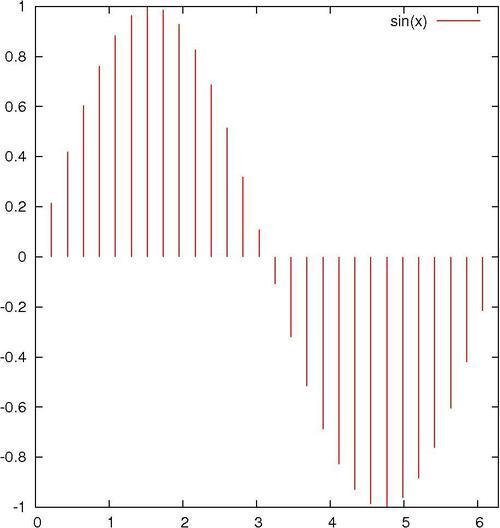
set samples 30
plot [0:2*pi] sin(x) with impulses lw 2

How it works…

The first command set the number of points used to sample or plot the function. The plot command tells gnuplot to use the impulse style, which draws a line from the x-axis to each y value; the thickness of the line is given by lw 2.

There's more…

A "stem plot" is sometimes used in electrical engineering. It is similar to the impulse plot, but with a mark at the end of each stick; this allows the eye to more easily follow the trend of the data; conversely, the sticks make it easier to read the graph, especially when the data is sparse, compared with a simple point plot. Use the following recipe to create a stem plot of a decaying sine wave, illustrated in the following figure:

set samples 50
plot [0:4*pi] exp(-x/4.)*sin(x) with impulses lw 2 notitle,\exp(-x/4.)*sin(x) with points pt 7

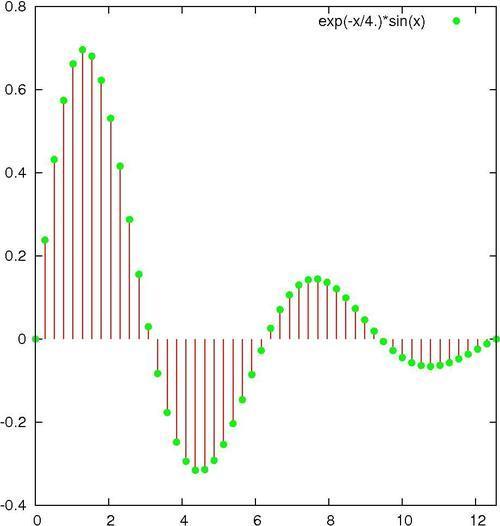
As you can see, we have plotted the same function twice. The first time through plot the impulses, as in the previous script, and the second time we plot the function again with points to draw the dots.

The previous plot shows a typical exponentially damped sine wave; it represents, for example, the motion of a pendulum with friction.

Previous PageNext Page
You have been reading a chapter from
gnuplot Cookbook
Published in: Feb 2012Publisher: PacktISBN-13: 9781849517249
Register for a free Packt account to unlock a world of extra content!
A free Packt account unlocks extra newsletters, articles, discounted offers, and much more. Start advancing your knowledge today.
undefined
Unlock this book and the full library FREE for 7 days
Get unlimited access to 7000+ expert-authored eBooks and videos courses covering every tech area you can think of
Renews at $15.99/month. Cancel anytime

Author (1)

author image
Lee Phillips

Lee Phillips grew up on the 17th floor of a public housing project on the Lower East Side of Manhattan. He attended Stuyvesant High School and Hampshire College, where he studied Physics, Mathematics, and Music. He received a Ph.D. in 1987 from Dartmouth in theoretical and computational physics for research in fluid dynamics. After completing post-doctoral work in plasma physics, Dr. Phillips was hired by the Naval Research Laboratory in Washington, DC, where he worked on various problems, including the NIKE laser fusion project. Dr. Phillips is now the Chief Scientist of the Alogus Research Corporation, which conducts research in the physical sciences and provides technology assessment for investors.
Read more about Lee Phillips