Reader small image

You're reading from  gnuplot Cookbook

Product typeBook
Published inFeb 2012
PublisherPackt
ISBN-139781849517249
Edition1st Edition
Tools
Right arrow
Author (1)
Lee Phillips
Lee Phillips
author image
Lee Phillips

Lee Phillips grew up on the 17th floor of a public housing project on the Lower East Side of Manhattan. He attended Stuyvesant High School and Hampshire College, where he studied Physics, Mathematics, and Music. He received a Ph.D. in 1987 from Dartmouth in theoretical and computational physics for research in fluid dynamics. After completing post-doctoral work in plasma physics, Dr. Phillips was hired by the Naval Research Laboratory in Washington, DC, where he worked on various problems, including the NIKE laser fusion project. Dr. Phillips is now the Chief Scientist of the Alogus Research Corporation, which conducts research in the physical sciences and provides technology assessment for investors.
Read more about Lee Phillips

Right arrow

Making a scatterplot


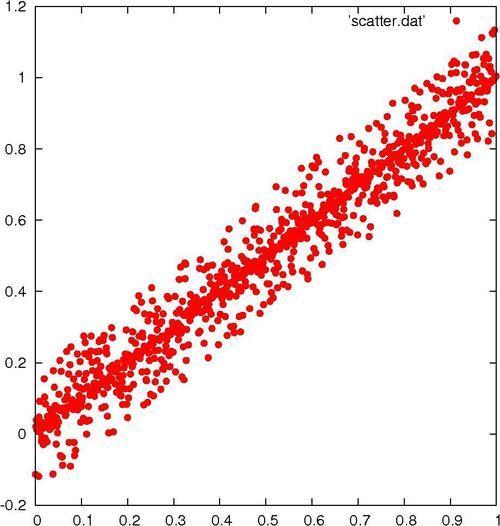
If you are in possession of a collection of measurements that, as is usually the case, is subject to random errors, an attempt to simply plot a curve through the measurements may result in a chaotic graph that will be difficult to interpret. In these cases, one usually begins with a scatterplot, which is simply a plot of a dot or small symbol at each data point. An examination of such a plot often leads to the discovery of correlations or patterns.

Getting ready

To make this recipe interesting, we need some slightly random-looking data. You may have some available, in which case you merely need to ensure that it is in a format that gnuplot can read. Simply arrange the data so that each line of the file contains one data point with space-separated x and y values:

x1 y1
x2 y2
...

Then name the file scatter.dat.

If you don't have such a file of your own handy, use the one called scatter.dat that we have provided. Make sure that the file is in the directory in which you have started gnuplot, so that the program can find it.

How to do it…

Tip

Some of the recipes in this book will not work as intended if entered in the same interactive session unless you give the reset command first. This is because these scripts make settings that change gnuplot's default behavior.

Now simply tell gnuplot:

plot 'scatter.dat' with points pt 7

If you are using the file we provided, you will get a plot similar to the one shown in the previous figure.

There's more…

You can plot the points using different symbols. Try plot 'scatter.dat' with dots to get the smallest dot available to your terminal. For use with scatterplots of very large datasets, try the following command:

plot 'scatter.dat' with points pt n

With different integers for n. pt stands for pointtype, and the different pointtypes available are dependent on your terminal. Simply type test in gnuplot to see a demonstration of all the pointtypes available for the currently selected terminal. You can find more about point and line styles in Chapter 3, Applying Colors and Styles.

Previous PageNext Page
You have been reading a chapter from
gnuplot Cookbook
Published in: Feb 2012Publisher: PacktISBN-13: 9781849517249
Register for a free Packt account to unlock a world of extra content!
A free Packt account unlocks extra newsletters, articles, discounted offers, and much more. Start advancing your knowledge today.
undefined
Unlock this book and the full library FREE for 7 days
Get unlimited access to 7000+ expert-authored eBooks and videos courses covering every tech area you can think of
Renews at $15.99/month. Cancel anytime

Author (1)

author image
Lee Phillips

Lee Phillips grew up on the 17th floor of a public housing project on the Lower East Side of Manhattan. He attended Stuyvesant High School and Hampshire College, where he studied Physics, Mathematics, and Music. He received a Ph.D. in 1987 from Dartmouth in theoretical and computational physics for research in fluid dynamics. After completing post-doctoral work in plasma physics, Dr. Phillips was hired by the Naval Research Laboratory in Washington, DC, where he worked on various problems, including the NIKE laser fusion project. Dr. Phillips is now the Chief Scientist of the Alogus Research Corporation, which conducts research in the physical sciences and provides technology assessment for investors.
Read more about Lee Phillips