

Running your first query
In this section, we are going to clone the Git repository, connect to an example ADX cluster called https://help.kusto.windows.net, which is provided by Microsoft, execute our first KQL query, and generate a bar chart showing population data per state in the US:
- If you are using Windows, open a new PowerShell terminal; if you are using macOS, then open a new Terminal or a Shell if you are using Linux. Clone the accompanying Git repository by typing
git clonehttps://github.com/PacktPublishing/Scalable-Data-Analytics-with-Azure-Data-Explorer.git. - Open your browser and go to https://dataexplorer.azure.com. The URL will take you to the ADX UI, the interactive environment for querying your data. Do not worry about the panes and layout. The ADX UI will be discussed in more detail in Chapter 3, Exploring the Azure Data Explorer UI. If you are prompted, log in with your Microsoft account. If your browser gets stuck in a refresh/redirect loop, please ensure you have allowed third-party cookies and check your SameSite cookie settings. You need to allow cookies from
portal.azure.comanddataexplorer.azure.com. This issue is rare and only happened once when using Safari on macOS. Microsoft added a nice convenient feature whereby the web UI automatically connects to the help cluster (https://help.kusto.windows.net/). You can skip steps 3 and 4 if you see the help cluster in the cluster pane. - Once you are logged in, the next step is to connect to an ADX cluster. Microsoft provides an example cluster, which we will be using throughout the book alongside the cluster we will create in Chapter 2, Building Your Azure Data Explorer Environment.
Click Add Cluster, as shown in Figure 1.6, and enter https://help.kusto.windows.net as the connection URL. The Display Name field will be populated with the cluster name, in this instance, help.
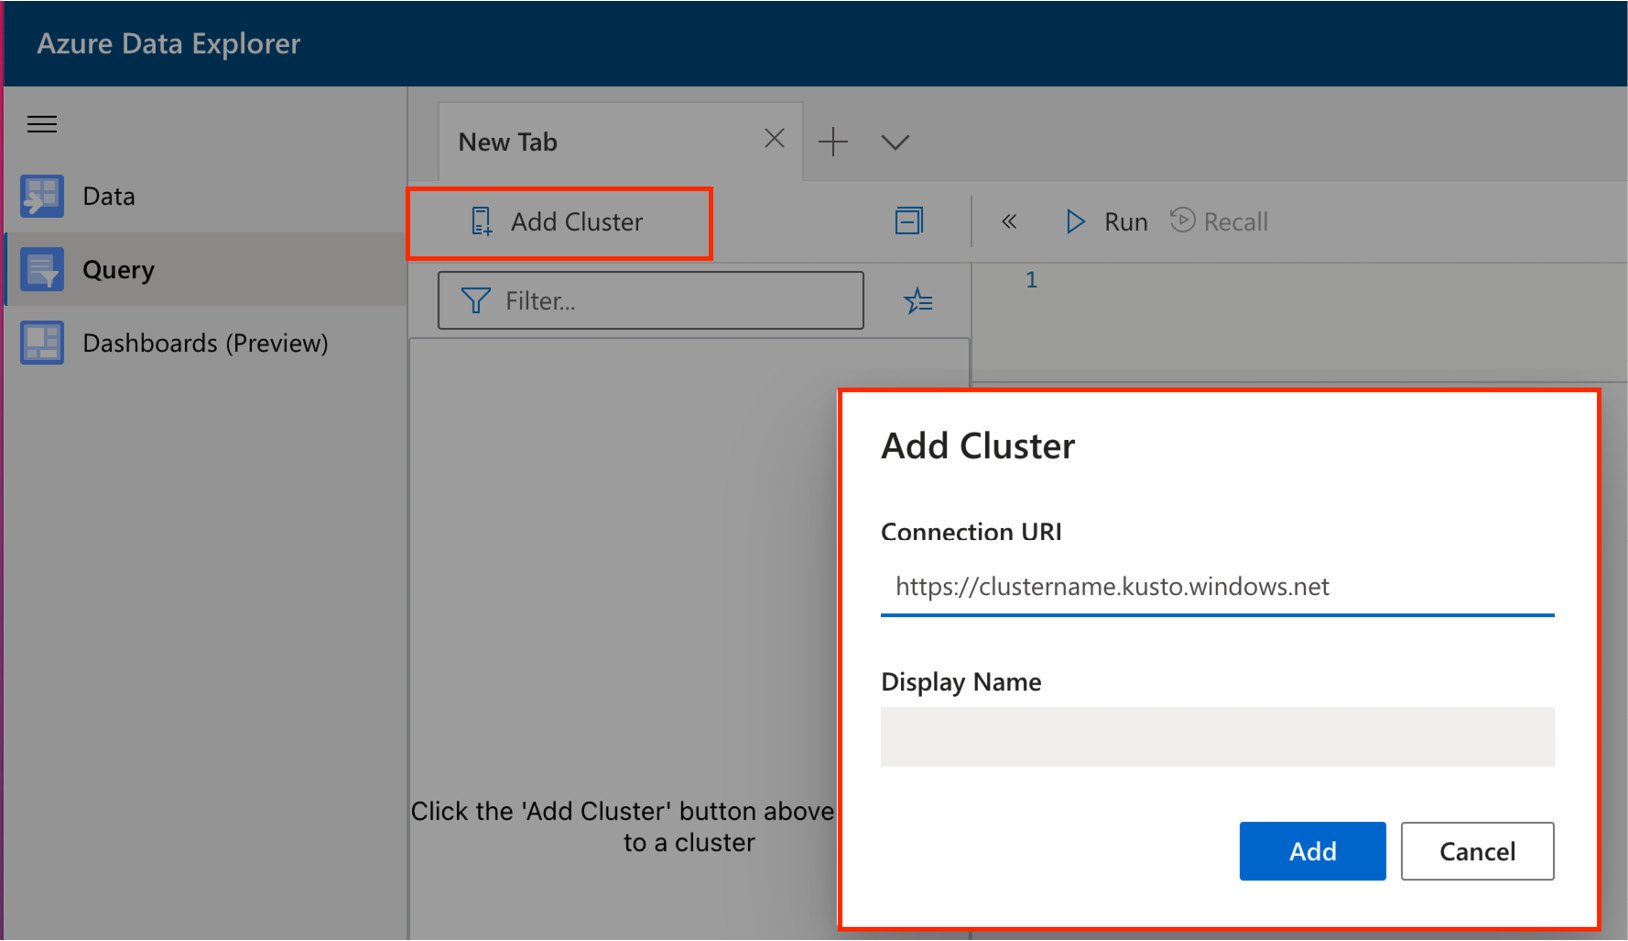
Figure 1.6 – Connecting to ADX clusters
- Once connected, the help cluster will appear in the cluster pane, which is located below the Add Cluster button, as shown in Figure 1.7:
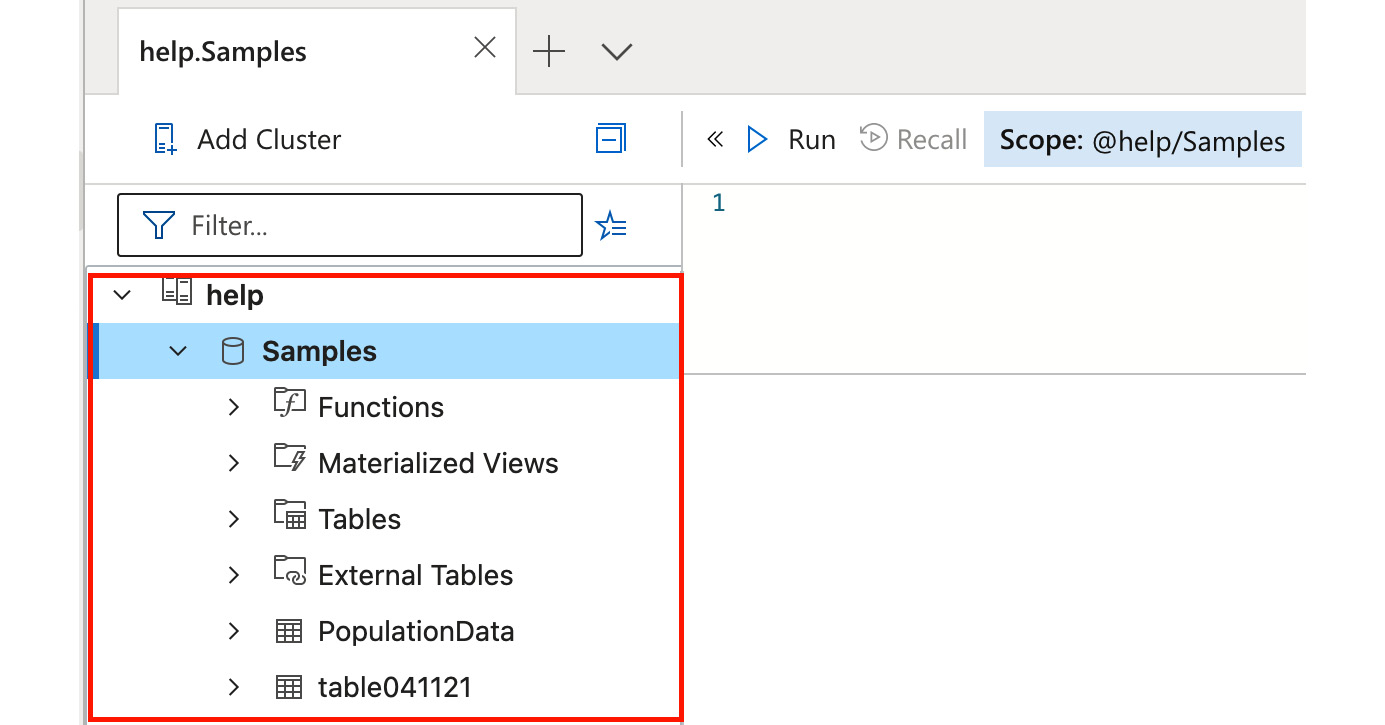
Figure 1.7 – Connected to the help cluster
- Expand the cluster and click the Samples database to set the scope to @help/Samples, as shown in Figure 1.8:
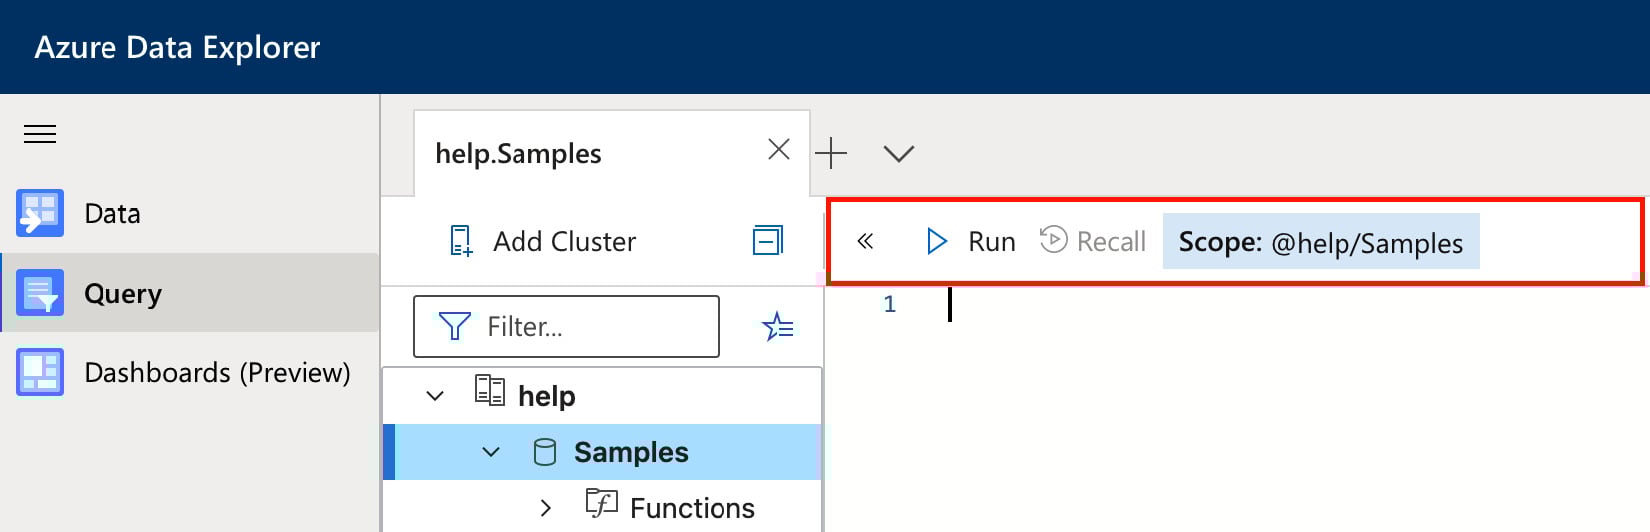
Figure 1.8 – Expand the cluster and set the scope
- Next, click File | Open, as shown in Figure 1.9, and open
${HOME}/Scalable-Data-Analytics-with-Azure-Data-Explorer/Chapter01/first-query.kql:
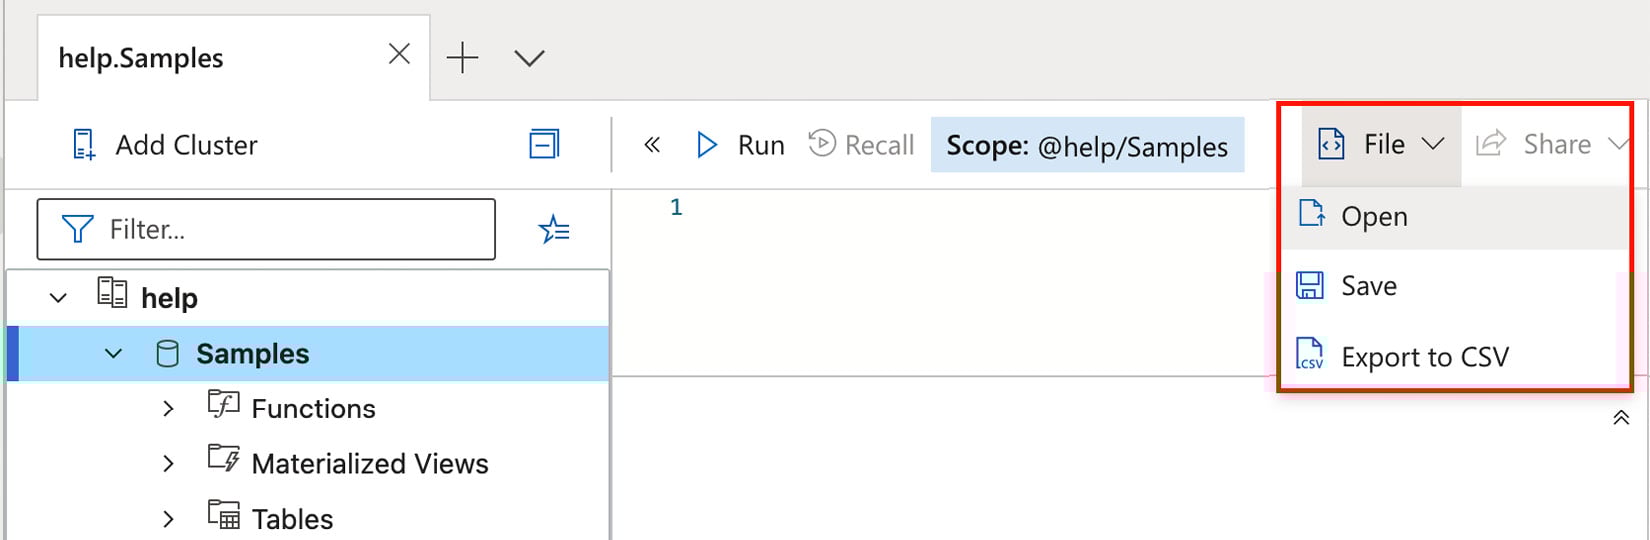
Figure 1.9 – Open query in ADX
- Finally, click Run, and you should see the population data, as shown in Figure 1.10. Even though the dataset is relatively small, ADX sorted the states by population in descending order and rendered the result as a bar chart in under 1 second:
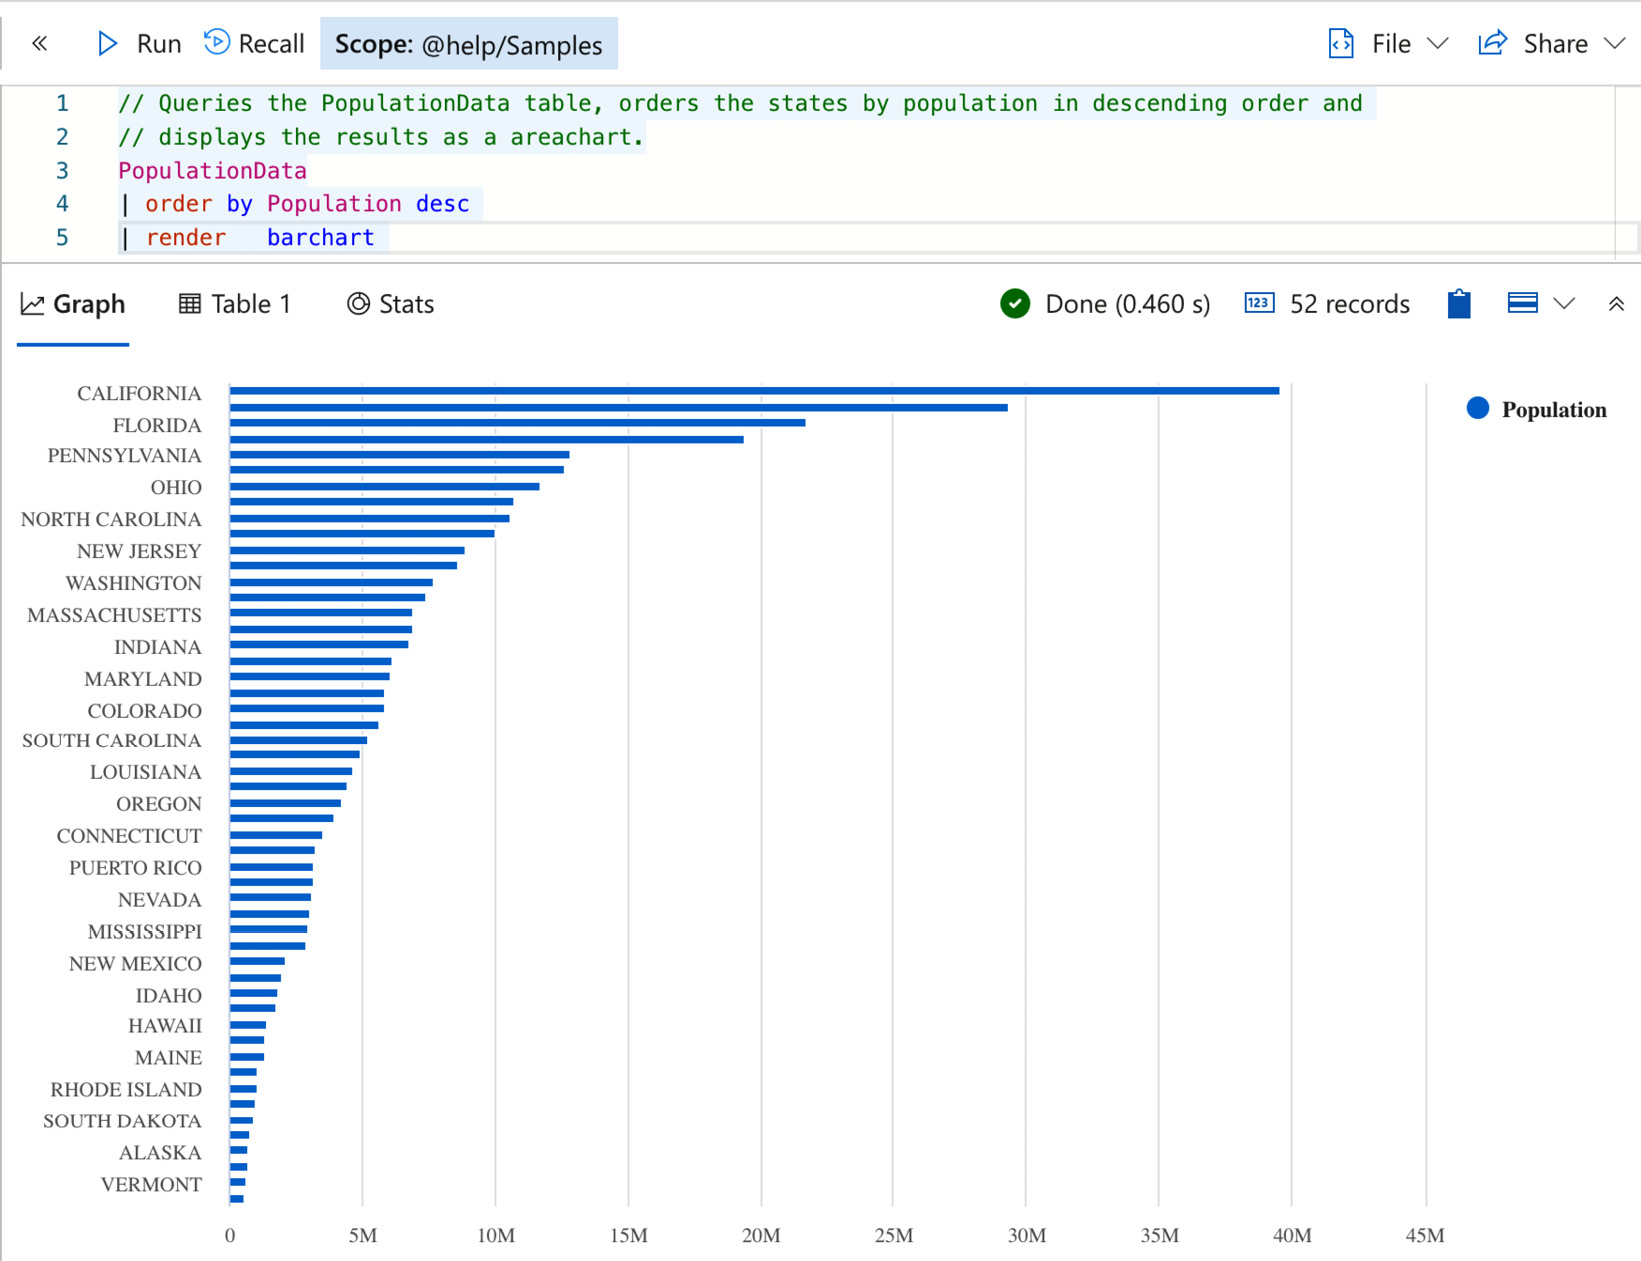
Figure 1.10 – US state population rendered as a bar chart
This section was just a high-level introduction to the ADX UI and KQL. Don't worry if you did not understand everything at this point; we will discuss all the topics in more detail throughout the remainder of the book.