Reader small image

You're reading from  R Statistics Cookbook

Product typeBook
Published inMar 2019
Reading LevelExpert
PublisherPackt
ISBN-139781789802566
Edition1st Edition
Languages
Tools
Concepts
Right arrow
Author (1)
Francisco Juretig
Francisco Juretig
author image
Francisco Juretig

Francisco Juretig has worked for over a decade in a variety of industries such as retail, gambling and finance deploying data-science solutions. He has written several R packages, and is a frequent contributor to the open source community.
Read more about Francisco Juretig

Right arrow

Generating random numbers from multiple distributions

R includes routines to generate random numbers from many distributions. Different distributions require different algorithms to generate random numbers. In essence, all random number generation routines rely on a uniform random number generator that generates an output between (0,1), and then some procedure that transform this number according to the density that we need.

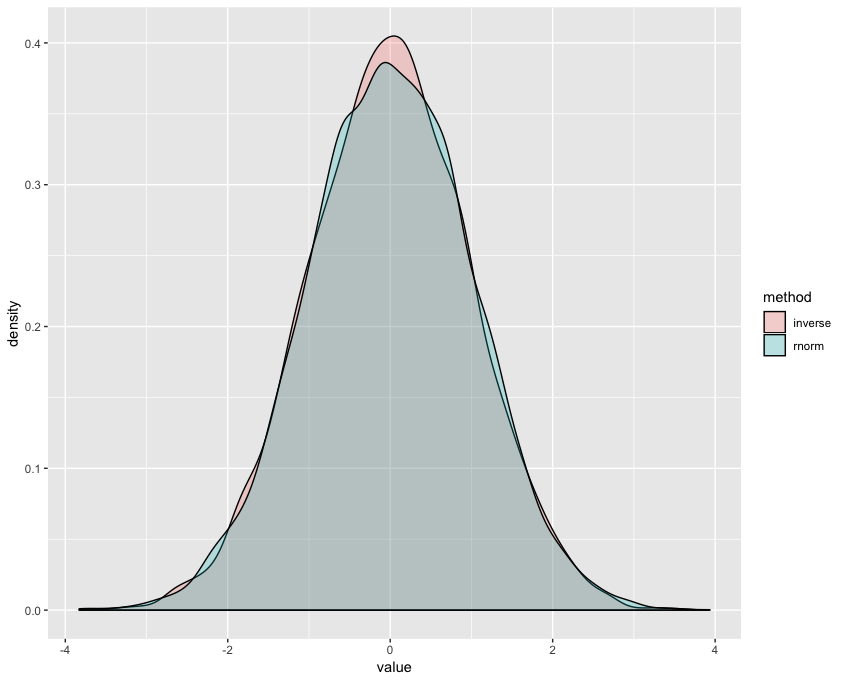
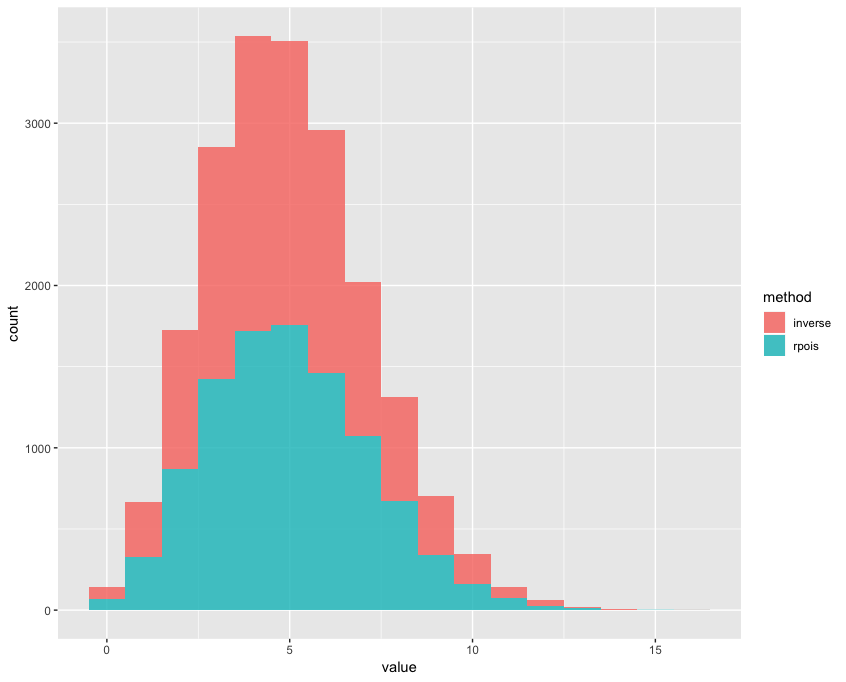
There are several ways of doing this, depending on which distribution we want to generate. A very simple one, which works for a large amount of cases is the inverse transformation method. The idea is to generate uniform random numbers, and find the corresponding quantile for the distribution that we want to sample from.

Getting ready

We need to install the ggplot2, and tidyr packages which can be installed via install.packages().

How to do it...

We will generate two samples of 10,000 random numbers, the first one via the rnorm function, and the second one using the inverse transformation method.

  1. Generate two samples of 10000 random numbers:
rnorm_result = data.frame(rnorm = rnorm(10000,0,1))
inverse_way = data.frame(inverse = qnorm(runif(10000),0,1))
  1. We concatenate the two datasets. Note that we are transposing it using the gather function. We need to transpose the data for plotting both histograms later via ggplot:
total_table = cbind(rnorm_result,inverse_way)
transp_table = gather(total_table)
colnames(transp_table) = c("method","value")
  1. We will then plot the histogram:
ggplot(transp_table, aes(x=value,fill=method)) + geom_density(alpha=0.25) 

How it works...

We are generating two samples, then joining them together and transposing them (from a wide format into a long format). For this, we use the gather function from the tidyr package. After that, we use the ggplot function to plot the two densities on the same plot. Evidently, both methods yield very similar distributions as seen in the following screenshot:

There's more...

The method can also be used to generate random numbers for discrete distributions as well. For example, we can generate random numbers according to a Poisson distribution with a value λ = 5. As you can see in the histogram, we are generating a very similar amount of counts for each possible value that the random variable can take:

rpois_result = data.frame(rpois = rpois(10000,5))
inverse_way = data.frame(inverse = qpois(runif(10000),5))
total_table = cbind(rpois_result,inverse_way)
transp_table = gather(total_table)
colnames(transp_table) = c("method","value")
ggplot(transp_table, aes(x=value,fill=method)) + geom_histogram(alpha=0.8,binwidth=1)

This yields the following overlaid histogram:

Previous PageNext Page
You have been reading a chapter from
R Statistics Cookbook
Published in: Mar 2019Publisher: PacktISBN-13: 9781789802566
Register for a free Packt account to unlock a world of extra content!
A free Packt account unlocks extra newsletters, articles, discounted offers, and much more. Start advancing your knowledge today.
undefined
Unlock this book and the full library FREE for 7 days
Get unlimited access to 7000+ expert-authored eBooks and videos courses covering every tech area you can think of
Renews at $15.99/month. Cancel anytime

Author (1)

author image
Francisco Juretig

Francisco Juretig has worked for over a decade in a variety of industries such as retail, gambling and finance deploying data-science solutions. He has written several R packages, and is a frequent contributor to the open source community.
Read more about Francisco Juretig