Reader small image

You're reading from  R Statistics Cookbook

Product typeBook
Published inMar 2019
Reading LevelExpert
PublisherPackt
ISBN-139781789802566
Edition1st Edition
Languages
Tools
Concepts
Right arrow
Author (1)
Francisco Juretig
Francisco Juretig
author image
Francisco Juretig

Francisco Juretig has worked for over a decade in a variety of industries such as retail, gambling and finance deploying data-science solutions. He has written several R packages, and is a frequent contributor to the open source community.
Read more about Francisco Juretig

Right arrow

3D visualization with the plot3d package

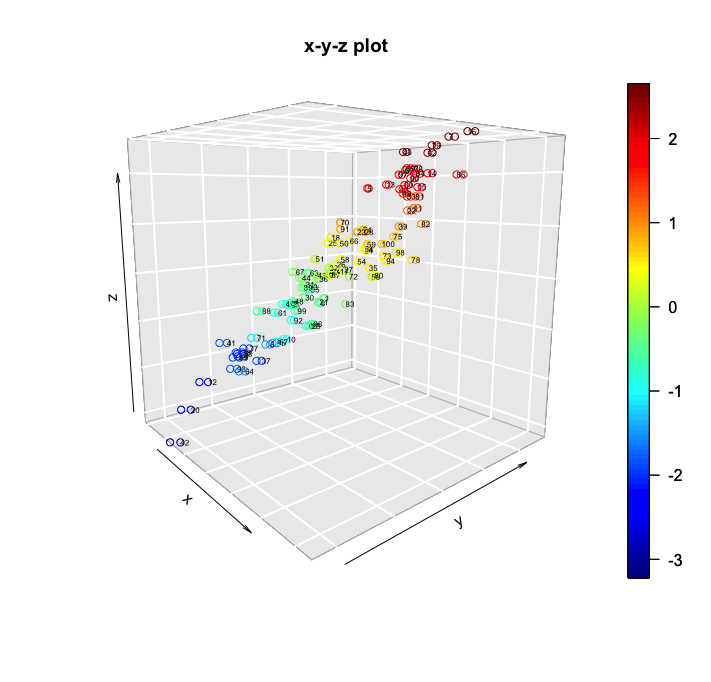
The plot3d package can be used to generate stunning 3-D plots in R. It can generate an interesting array of plots, but in this recipe we will focus on creating 3-D scatterplots. These arise in situations where we have three variables, and we want to plot the triplets of values on the x-y-z space.

We will generate a dataset containing random Gaussian numbers for three variables, and we will plot them into the same plot using the plot3d package.

Getting ready

This package can be installed in the usual way via install.packages("plot3D").

How to do it...

We will generate a dataset containing random gaussian numbers for three variables, and we will plot them into the same plot using the plot3d package.

  1. Import the plot3D library:
library(plot3D)
  1. Generate a dataset containing random Gaussian numbers for three variables:
x = rnorm(100)
y = rnorm(100)
z = x + y + rnorm(100,0,0.3)
idrow = 1:100
  1. Plot the variable in the same plot:
scatter3D(x, y, z, bty = "g", colkey = TRUE, main ="x-y-z plot",phi = 10,theta=50)
text3D(x, y, z, labels = idrow, add = TRUE, colkey = FALSE, cex = 0.5)

The following screenshot is the resulting 3D plot:

How it works...

The scatter3D function draws the scatterplot, and we have an interesting set of options for it. We can turn the color key on/off using the colkey parameter. phi and theta control the angles that will be used to show the plot. The color key is quite useful as it helps to highlight the observations that have higher Z values. This is useful because in 3-D plots it is sometimes difficult to understand a single image without rotating it. We are also using the text3D function to print the values for Z for each point. This step could certainly be omitted, but it is generally useful for isolating individual observations.

Previous PageNext Page
You have been reading a chapter from
R Statistics Cookbook
Published in: Mar 2019Publisher: PacktISBN-13: 9781789802566
Register for a free Packt account to unlock a world of extra content!
A free Packt account unlocks extra newsletters, articles, discounted offers, and much more. Start advancing your knowledge today.
undefined
Unlock this book and the full library FREE for 7 days
Get unlimited access to 7000+ expert-authored eBooks and videos courses covering every tech area you can think of
Renews at $15.99/month. Cancel anytime

Author (1)

author image
Francisco Juretig

Francisco Juretig has worked for over a decade in a variety of industries such as retail, gambling and finance deploying data-science solutions. He has written several R packages, and is a frequent contributor to the open source community.
Read more about Francisco Juretig