
The formattable package provides an excellent way of formatting tables, allowing us to change the color of each column, add icons, and add conditional formatting. This is extremely powerful compared to R's native table output capabilities.
Formatting tabular data with the formattable package
Getting ready
In order to run this example, the formattable package needs to be installed using install.packages("formattable").
How to do it...
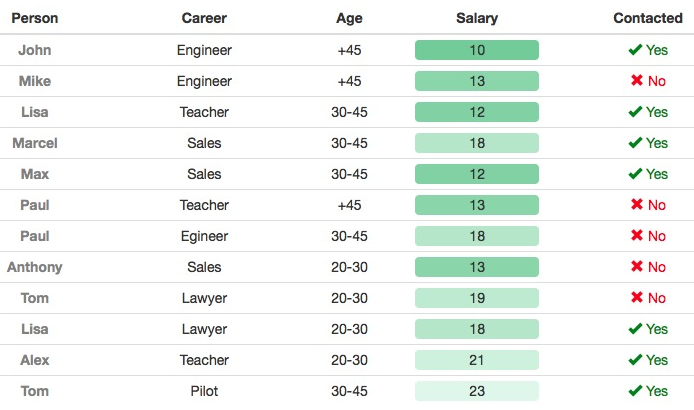
In this example, we will load a dataset from a .csv file, and we will apply different formatting to each column. More interestingly, we will apply conditional formatting to certain columns. This dataset will contain several fields, such as the career, the age, the salary, and whether the person has been contacted.
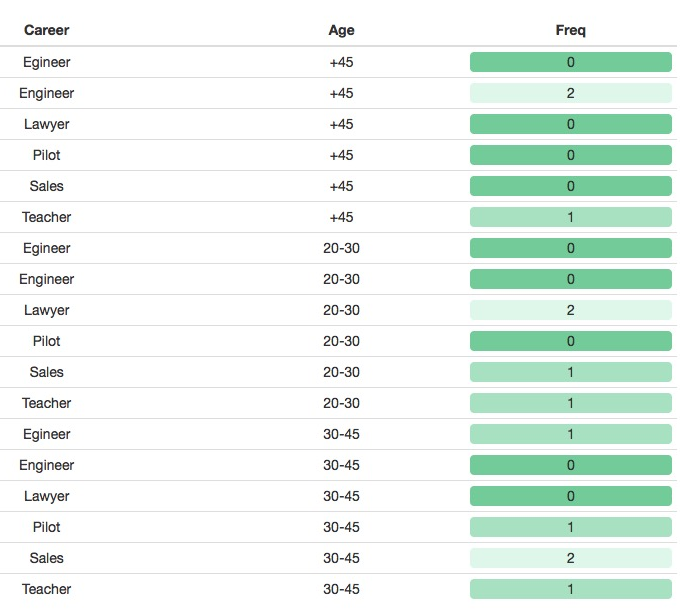
After that, we can use the table function to calculate the counts using two variables. We then use the same formattable package for coloring the frequencies in this table.
- Import the libraries:
library(expss)
library(formattable)
- Load the data and specify the format for each column. For the Person column, we do basic formatting (specifying the color and font weight), and for the Salary column, we use a color scale ranging between two different green colors. For the Contacted column, we define a conditional formatting (green or red) with an appropriate icon:
data = read.csv("/Users/admin/Documents/R_book/person_salary.csv", stringsAsFactors  = FALSE)
Green = "#71CA97"
Green2 = "#DeF7E9"
table__out = data.frame(table(data$Career, data$Age))
colnames(table__out) = c("Career", "Age", "Freq")
formattable(table__out, align =c("c", "c", "c"), list("Freq"= color_tile(Green, Green2)))
This results in the following output:
How it works...
The formattable package requires a data frame to work. We then have lots of options for each column that we want to format. Before specifying the format for each column, we are setting the alignment for each column (in this case we want to center each column, using the c option for each one).
There's more...
This package is particularly interesting when calculating tables using the tables() function. For example, we might want to calculate the number of cases that we have for all the combinations of career and age, and then paint that column on a green color scale:
formattable(data,align =c("c","c","c","c"), list("Person" = formatter("span", style = ~ style(color = "grey",font.weight = "bold")), "Salary"= color_tile(Green, Green2),
"Contacted" = formatter("span", style = x ~ style(color = ifelse(x, "green", "red")),
 x ~ icontext(ifelse(x, "ok", "remove"), ifelse(x, "Yes", "No")))))
The following screenshot shows the output (the contacted column now contains ticks and crosses):