Reader small image

You're reading from  R Statistics Cookbook

Product typeBook
Published inMar 2019
Reading LevelExpert
PublisherPackt
ISBN-139781789802566
Edition1st Edition
Languages
Tools
Concepts
Right arrow
Author (1)
Francisco Juretig
Francisco Juretig
author image
Francisco Juretig

Francisco Juretig has worked for over a decade in a variety of industries such as retail, gambling and finance deploying data-science solutions. He has written several R packages, and is a frequent contributor to the open source community.
Read more about Francisco Juretig

Right arrow

Calculating densities, quantiles, and CDFs

R provides a vast number of functions for working with statistical distributions. These can be either discrete or continuous. Statistical functions are important, because in statistics we generally need to assume that the data is distributed to some distribution.

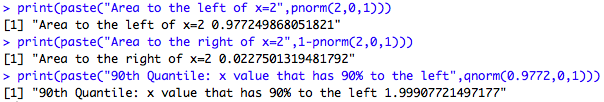
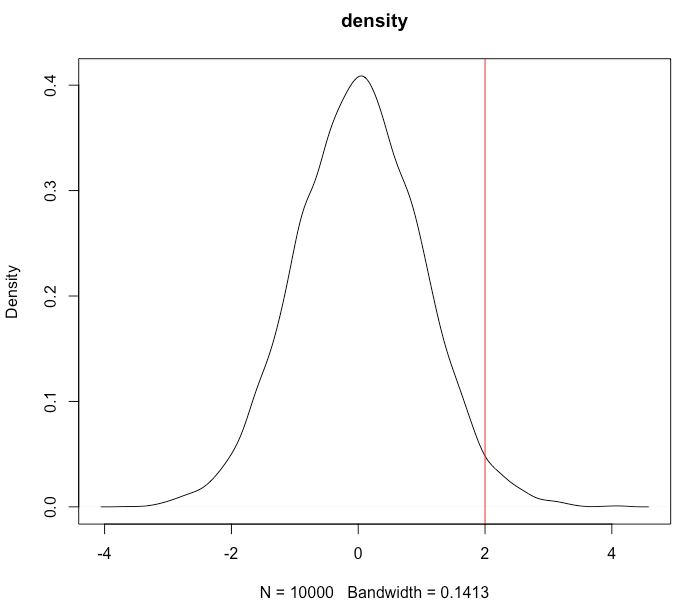
Let's assume we have an variable distributed according to a specific distribution. The density function is a function that maps every value in the domain in the distribution of the variable with a probability. The cumulative density function (CDF) returns the cumulative probability mass for each value of . The quantile function expects a probability (between 0 and 1) and returns the value of that has a probability mass of to the left. For most distributions, we can use specific R functions to calculate these. On the other hand, if we want to generate random numbers according to a distribution, we can use R's random number generators random number generators (RNGs).

Getting ready

No specific package is needed for this recipe.

How to do it...

In this recipe we will first generate some Gaussian numbers and then, using the pnorm() and qnorm() functions, we will calculate the area to the left and to the right of x=2, and get the 90th quantile to plot the density.

  1. Generate 10000 Gaussian random numbers:
vals = rnorm(10000,0,1)
  1. Plot the density and draw a red line at x=2:
plot(density(vals))
abline(v=2,col="red")
  1. Calculate the area to the left and to the right of x=2, using the pnorm() function and use the qnorm() quantile function to get the 97.7th quantile:
print(paste("Area to the left of x=2",pnorm(2,0,1)))
print(paste("Area to the right of x=2",1-pnorm(2,0,1)))
print(paste("90th Quantile: x value that has 97.72% to the left",qnorm(0.9772,0,1)))

After running the preceding code, we get the following output:

The following screenshot shows the density with a vertical line at 2:

How it works...

Most distributions in R have densities, cumulative densities, quantiles, and RNGs. They are generally called in R using the same approach (d for densities, q for quantiles, r for random numbers, and p for the cumulative density function) combined with the distribution name.

For example, qnorm returns the quantile function for a normal-Gaussian distribution, and qchisq returns the quantile function for the chi-squared distribution. pnorm returns the cumulative distribution function for a Gaussian distribution; pt returns it for a Student's t-distribution.

As can be seen in the diagram immediately previous, when we get the 97.7% quantile, we get 1.99, which coincides with the accumulated probability we get when we do pnorm() for x=2.

There's more...

We can use the same approach for other distributions. For example, we can get the area to the left of x=3 for a chi-squared distribution with 33 degrees of freedom:

print(paste("Area to the left of x=3",pchisq(3,33)))

After running the preceding code we get the following output:

Previous PageNext Page
You have been reading a chapter from
R Statistics Cookbook
Published in: Mar 2019Publisher: PacktISBN-13: 9781789802566
Register for a free Packt account to unlock a world of extra content!
A free Packt account unlocks extra newsletters, articles, discounted offers, and much more. Start advancing your knowledge today.
undefined
Unlock this book and the full library FREE for 7 days
Get unlimited access to 7000+ expert-authored eBooks and videos courses covering every tech area you can think of
Renews at $15.99/month. Cancel anytime

Author (1)

author image
Francisco Juretig

Francisco Juretig has worked for over a decade in a variety of industries such as retail, gambling and finance deploying data-science solutions. He has written several R packages, and is a frequent contributor to the open source community.
Read more about Francisco Juretig