

The ggplot package is great for creating static plots, but it can't handle animations. These are used when we have data indexed by time, and we want to show an evolution of that data. The gganimate package is designed following a similar logic, but for animations. It will construct plots for every time period and it will then interpolate between the frames in order to construct a smooth animation. This animation can also be exported as a GIF, then embedded later on any website or in any report.
Animations with the gganimate package
Getting ready
The gganimate package is not yet available on the Comprehensive R Archive Network (CRAN), so it needs to be downloaded from GitHub. In order to do that, we need the devtools package. It can be installed in the usual way and after that is done, we can call install_github to get the package from GitHub. In order to use this function, we need the devtools package.
How to do it...
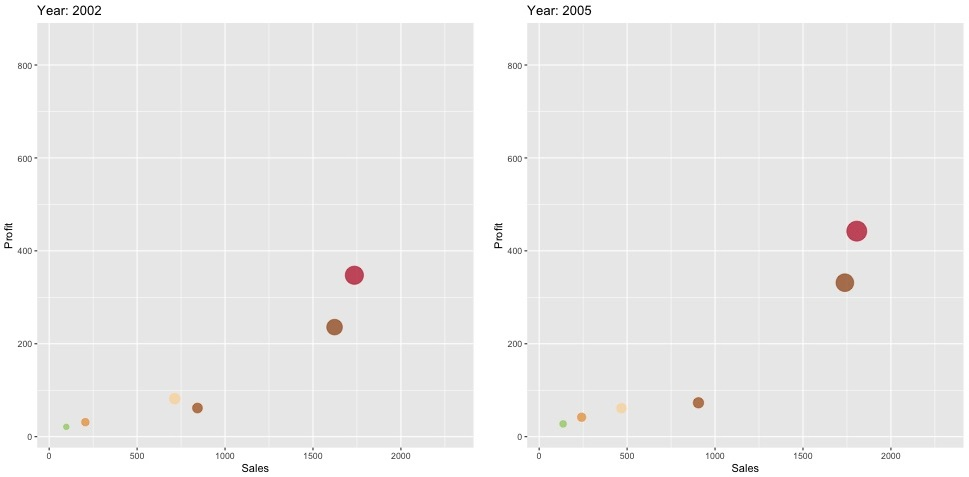
In this exercise, we have sales and profits for several companies across multiple years. We want to create a scatterplot (which shows pairs of values between sales and profit) animated through time.
- Start by installing the library:
install.packages('devtools')
devtools::install_github('thomasp85/gganimate')
- Load the necessary libraries:
# Load required package
library(gapminder)
library(ggplot2)
library(gganimate)
# Basic scatter plot
- Load the data and set the colors that will be used later:
data = read.csv("./companies.csv",stringsAsFactors = FALSE)
colors = c("A"="#AB5406","B"="#EC9936","C"="#BE1826","D"="#9B4A06","E"="#FDD6A2","F"="#9ACD62")
- Execute the ggplot function. Note that labs(), transition_time(), and ease_aes() are specific to the gganimate function, and are not ggplot elements:
p = ggplot(data, aes(Sales, Profit, size = Profit,colour=Company)) +
 geom_point(alpha = 0.7, show.legend = FALSE) +
 scale_colour_manual(values = colors) +
 scale_size(range = c(2, 12)) +
 labs(title = 'Year: {frame_time}', x = 'GDP per capita', y = 'life expectancy') +
 transition_time(Year) +
 ease_aes('linear')
- Animate, and save the output into a .gif file:
animate(p, nframes = 48, renderer = gifski_renderer("./gganim.gif"))
Here, we pick just two frames at random out of the total of 48:
How it works...
The core of our script is the animate function, which will make repeated calls to the ggplot part, which is included in p. The ggplot function is just creating a regular scatterplot, and most of the code there defines the formatting and colors that we want. The only different part from a regular ggplot statement are these two parts: transition_time(Year) and ease_aes("linear"). The former specifies the variable that indicates the time steps, while the latter specifies the type of interpolation used to generate all the frames that we need. The animate function will make repeated calls to this, for purposes such as changing the year and using a linear interpolation.
See also
The package's website (https://github.com/thomasp85/gganimate) contains several other examples, such as animated boxplots.