


The role of JavaScript has shifted significantly from a few simple client routines to a dominant language to create and manage web user interfaces. The programming technique has moved towards object-oriented with the introduction of function object, prototype, and closure. This was driven by a group of pioneers such as Douglas Crockford, who was responsible for transforming the language to educate and make JavaScript a better language with his book JavaScript: The Good Parts, O'Reilly Media / Yahoo Press Others include Sam Stephenson, creator of the Prototype JavaScript library (http://www.prototypejs.org), and John Resig, creator of the JQuery library (http://jquery.com), who brought JavaScript into a framework for building more complicated frontend web software.
It is beyond the scope of this book to give an introduction to this new programming style. Readers are expected to know the basics of jQuery and CSS selector syntax, which are used in some of the chapters. Readers should also be familiar with the advanced JavaScript scripting described in the book JavaScript: The Good Parts, O'Reilly Media / Yahoo Press, such as prototypes, closure, inheritance, and function objects.
In this section, two HTML5 technologies, SVG and Canvas, are covered, along with examples.
HTML5 is the biggest advance so far in the HTML standard. The adoption of the standard is growing fast (also fuelled by Apple mobile devices, which stopped supporting Adobe Flash). Again, it is beyond the scope of this book to cover them. However, the most relevant part to web charting is Scalable Vector Graphics (SVG). SVG is an XML format for describing vector-based graphics that is composed of components such as paths, text, shapes, color, and so on. The technology is similar to PostScript, except that PostScript is a stack-based language. As implied by its name, one of the major advantages of SVG is that it is a lossless technology (the same as PostScript): it doesn't suffer from any pixelation effects by enlarging the image. A reduced image size will not suffer from loss of original content.
Furthermore, SVG can be scripted with timing animation Synchronized Multimedia Integration Language (SMIL) and event handling. Apart from IE, this SVG technology is supported by all mainstream browsers, http://caniuse.com/#feat=svg-smil.
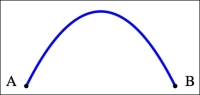
The following is a simple example of SVG code showing a single curved line between two points:
<svg xmlns="http://www.w3.org/2000/svg" version="1.1">
  <path id="curveAB" d="M 100 350 q 150 -300 300 0" stroke="blue" stroke-width="5" fill="none" />
  <!-- Mark relevant points -->
  <g stroke="black" stroke-width="3" fill="black">
    <circle id="pointA" cx="100" cy="350" r="3" />
    <circle id="pointB" cx="400" cy="350" r="3" />
  </g>
  <!-- Label the points -->
  <g font-size="30" font="sans-serif" fill="black" stroke="none" text-anchor="middle">
    <text x="100" y="350" dx="-30">A</text>
    <text x="400" y="350" dx="30">B</text>
  </g>
</svg>
The preceding SVG code is executed in the following steps:
Draw a path with
id="curveAB"with data (d). First, moveMto an absolute coordinate (100,350), then draw a Bézier quadratic curve from the current position to (150,-300) and finish at (300,0).Group (
g) the two circle elements—"pointA"and"pointB"—with the center coordinates (100,350) and (400,350) respectively with a radius of3pixels. Then fill both circles in black.Group the two text elements
AandB, started at (100,350) and (400,350), which display with the sans-serif font in black, and then shift along the x-axis (dx)30pixels left and right, respectively.
The following is the final graph from the SVG script:
Canvas is another new HTML5 standard that is used by some JavaScript chart software packages. The purpose of Canvas is as its name implies; you declare a drawing area on the canvas tag, then use the new JavaScript APIs to draw lines and shapes in pixels. This is the distinct difference between the two techniques: Canvas is pixel-based, whereas SVG is vector-based. Canvas has no built-in animation routine, so API calls in timed sequences are used to simulate an animation. Also, there is no event-handling support, so developers need to manually attach event handlers to certain regions on the canvas. Fancy chart animation may prove more complicated to implement.
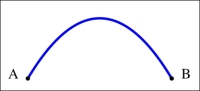
The following is an example of Canvas code that achieves the same effect as the preceding SVG curve:
<canvas id="myCanvas" width="500" height="300" style="border:1px solid #d3d3d3;">Canvas tag not supported</canvas>
<script type="text/javascript">
    var c=document.getElementById("myCanvas");
   var ctx=c.getContext("2d");
  // Draw the quadratic curve from Point A to B
   ctx.beginPath();
   ctx.moveTo(100, 250);
   ctx.quadraticCurveTo(250, 0, 400, 250);
   ctx.strokeStyle="blue";
   ctx.lineWidth=5;
   ctx.stroke();
  // Draw a black circle attached to the start of the curve
   ctx.fillStyle="black";
   ctx.strokeStyle="black";
   ctx.lineWidth=3;
   ctx.beginPath();
   ctx.arc(100,250,3, 0, 2* Math.PI);
   ctx.stroke();
   ctx.fill();
  // Draw a black circle attached to the end of the curve
   ctx.beginPath();
   ctx.arc(400,250,3, 0, 2* Math.PI);
   ctx.stroke();
   ctx.fill();
  // Display 'A' and 'B' text next to the points
   ctx.font="30px 'sans-serif'";
   ctx.textAlign="center";
   ctx.fillText("A", 70, 250);
   ctx.fillText("B", 430, 250);
</script>
As you can see, both canvas and SVG can do the same task, but Canvas requires more instructions:
Instead of a continuous path description in SVG, a sequence of JavaScript drawing methods is called. The preceding Canvas code follows these steps to draw the curve:
In the preceding example, it first calls
beginPathto start a path in the canvas, then issues themoveTocall to move the path starting point to the coordinate (100, 250) without creating a line. ThequadraticCurveTomethod creates the curve path from themoveTolocation to the top of the curve and the end point, which is (400, 250). Once the path is set up, we set up the stroke properties before calling thestrokemethod to draw the line along the path.We call
beginPathto reset to a new path to draw and invoke thearcmethod to create a tiny circular path at both the start and end coordinates of the curve path. Once we have set up the stroke and fill styles, we call thefillandstrokeroutines to fill it black, to act as a coordinate marker.Finally, we set up the font properties and create the text
AandBby callingfillTextwith the position near the coordinate markers.
In a nutshell, instead of a single tag with multiple attributes as in SVG, Canvas adopts multiple attribute-setting routines. SVG is mostly declarative, while Canvas enforces an imperative programming approach.