
The Most Common Data Cleaning Operations
Now that you’ve built a strong knowledge of data quality and the importance of assessing and documenting your data cleaning process, it’s time to roll your sleeves up and get stuck into some data.
In this chapter, you will be learning how to deal with the most common data cleaning steps within Power BI, as listed next. For each of these example topics, you will find a step-by-step walk-through on how to carry out these transformations yourself.
We will cover the following specific topics:
- Removing duplicates
- Removing missing data
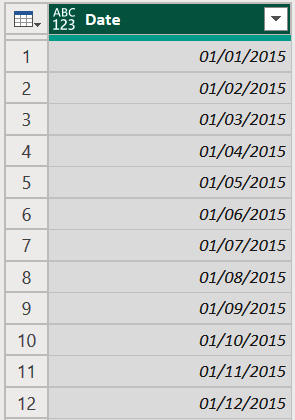
- Splitting columns
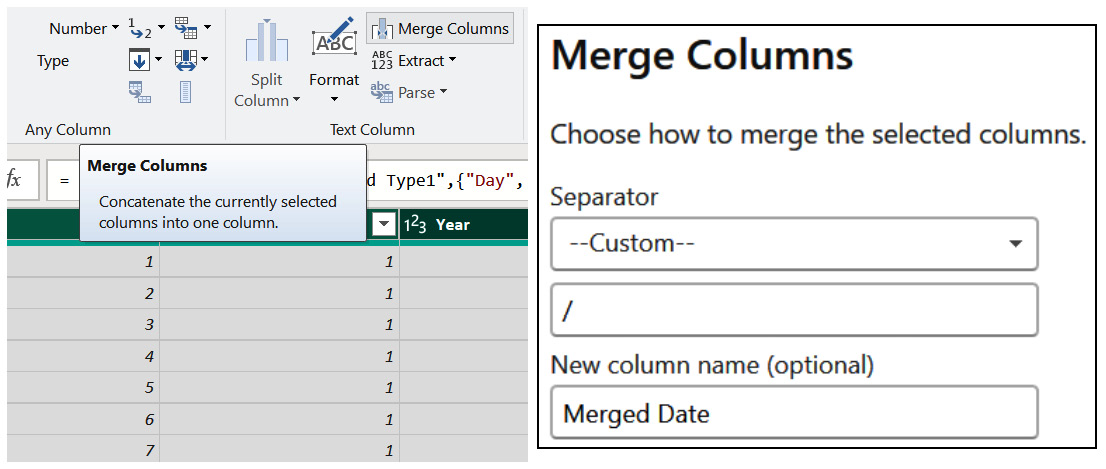
- Merging columns
- Replacing outliers
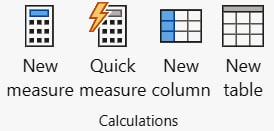
- Creating calculated columns versus measures
By the end of the chapter, you will have built a strong base of foundational knowledge on how to tackle some of the most common and simplest transformations that we often see needing to be done when connecting to data in Power BI.